Showing posts with label CFR. Show all posts

Sunday, 2 November 2014

Influenza A(H7N9) virus: detection numbers and graphs...

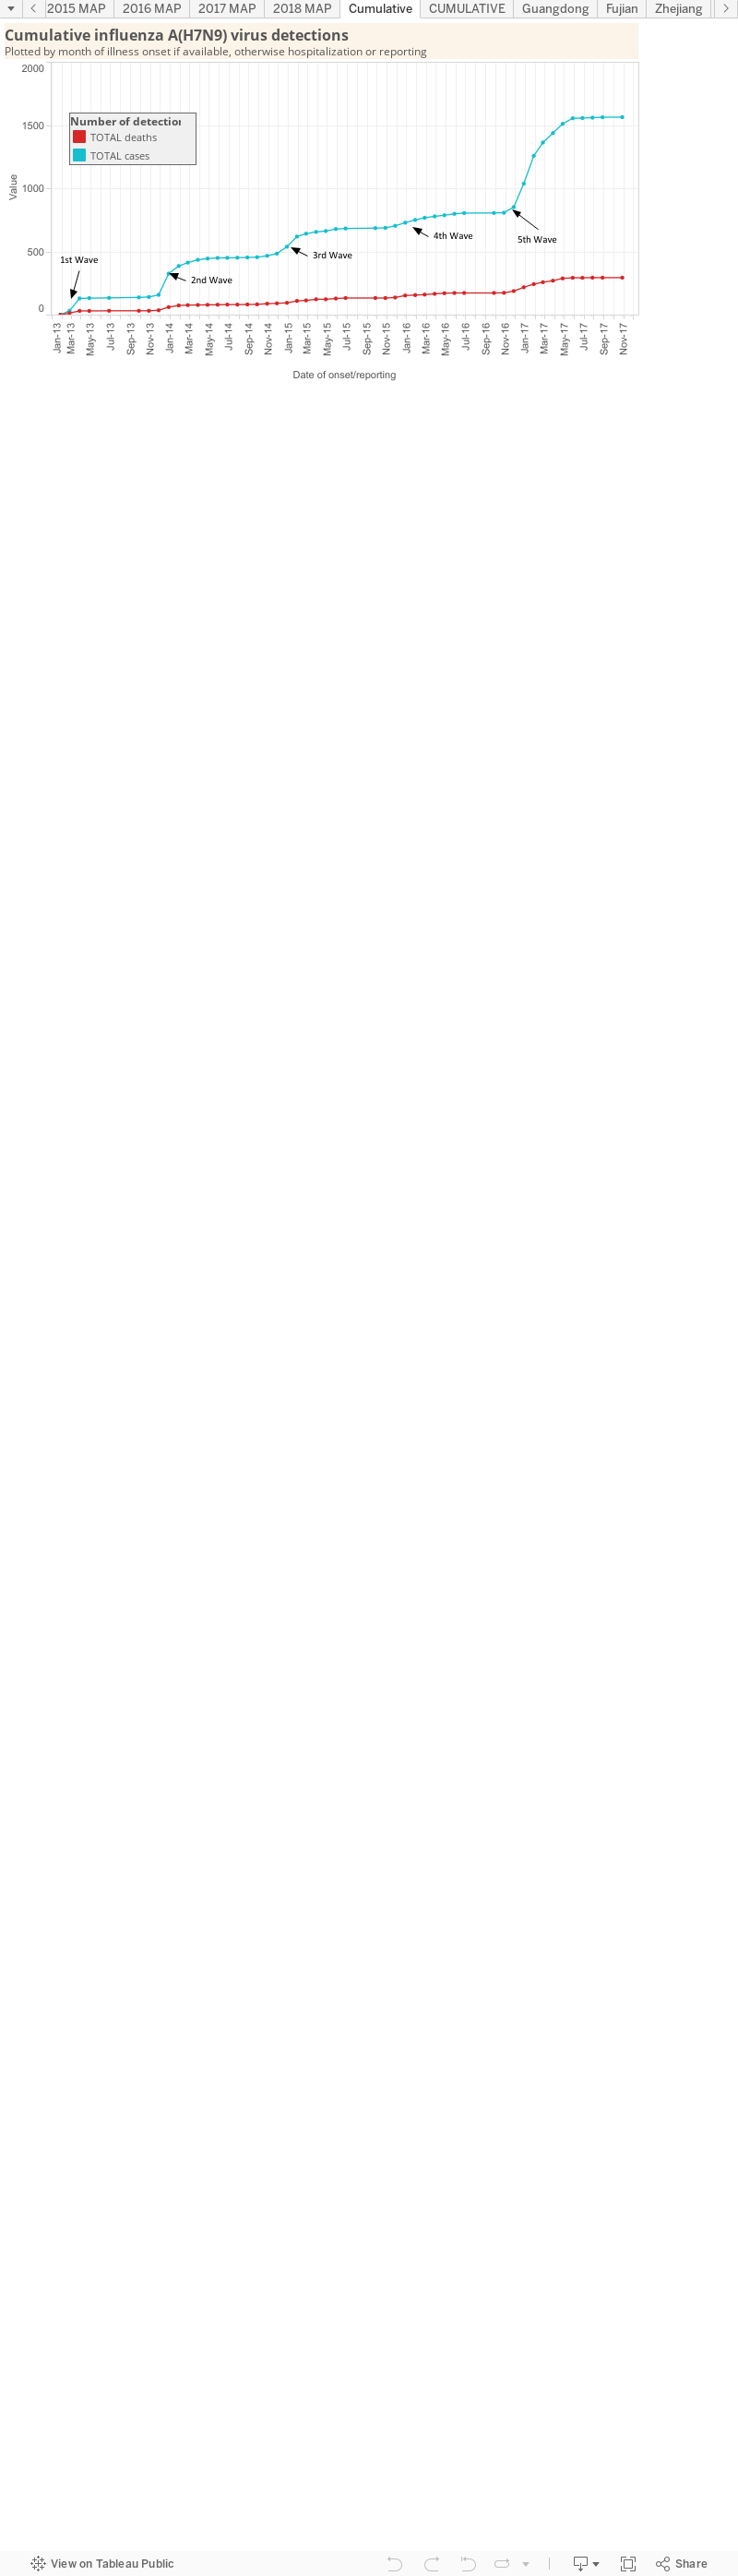
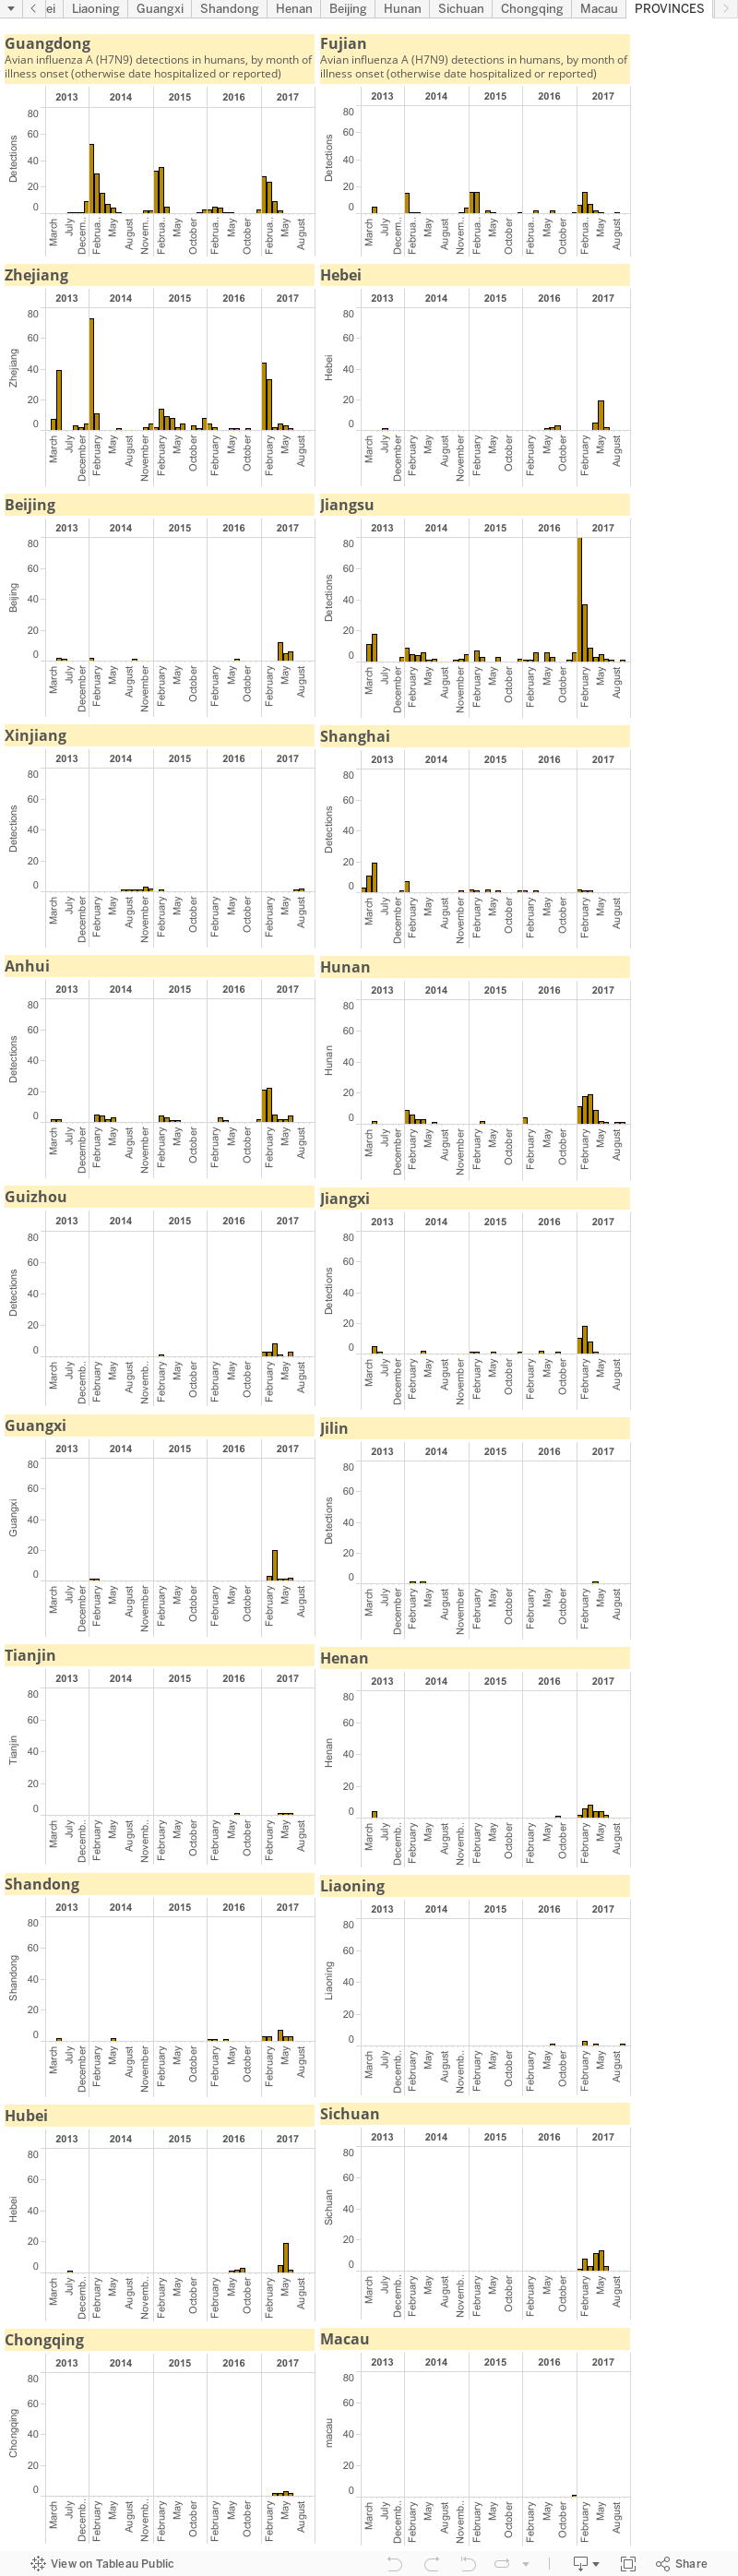
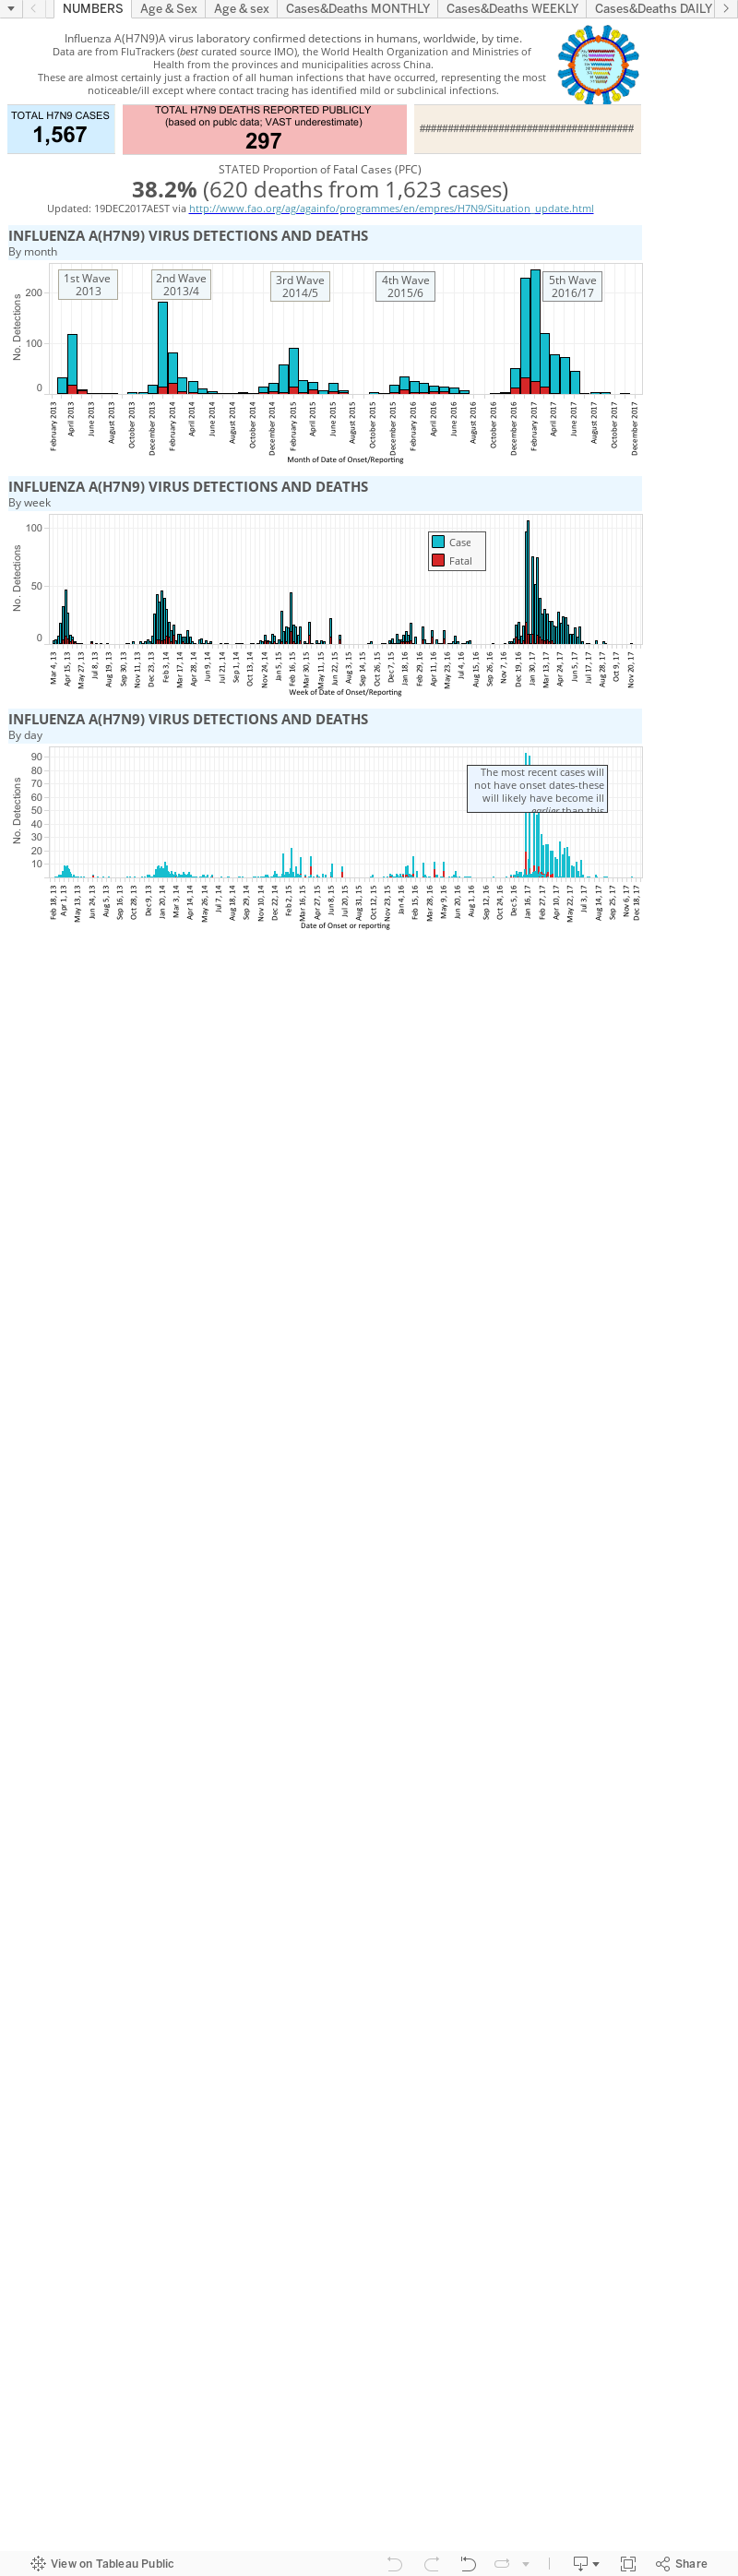
This is a static page that houses my graphs of influenza A(H7N9) virus ("H7N9") numbers produced by the various Ministries of Health for the provinces and municipalities of China, Hong Kong's Centre for Health Protection (CHP) the World Health Organization and FluTrackers.

Please be aware that these numbers are in flux during the winter epidemic. They are a guide only.

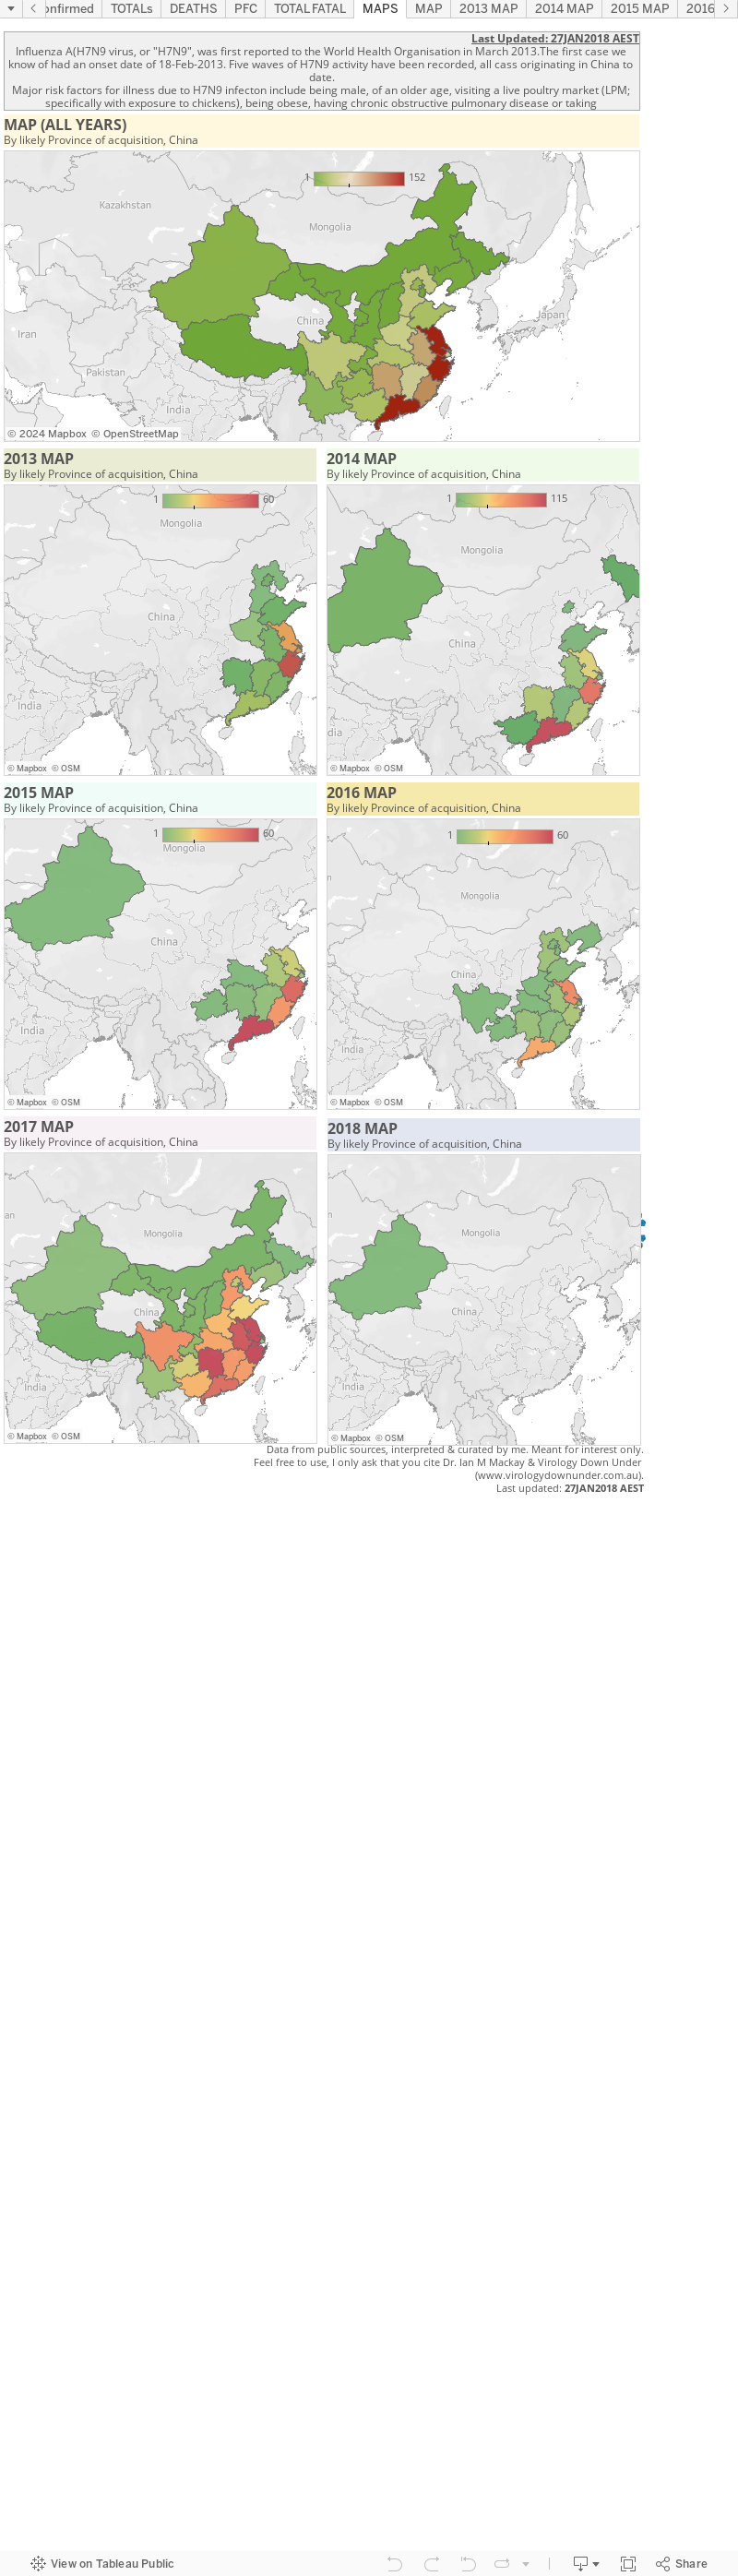
There is also an accompanying map page which for now is located here.


Reminders: 
  • The graphs above, as with all on VDU, are made for general interest only. They are also freely available for anyone's use, just cite the page and me please. The data can be downloaded by clicking on the "Download" link at the bottom-right of each dashboard. It may be that I have misinterpreted the language in the reports (sometimes a little tricky to wade through) or miscalculated some totals based on the way data have been presented.
  • In any outbreak, epidemic or pandemic caused by a know or emerging pathogen, the numbers presented publicly, and used in these graphs, are expected to represent only a fraction of all the cases that have and are occurring. This is just the nature of the imperfect biological'ness of these events.
  • I am only able to plot what is publicly available-you could do this too. No secret associations or back-room deals provide me with these data.

Thursday, 11 July 2013

New H7N9 numbers and Case Fatality Rate/Ratio/Risk [UPDATEDx2]

The latest Influenza A(H7N9) virus numbers are out and we can see the deaths have ticked up. We have no public information on these or many of the past releases either. With 132 cases (presumably this still does not include the Taiwan case or the asymptomatic Beijing boy, so I maintain 134) with 43 deaths.

My data (which suffer from the public reporting process; I do not mean to imply that WHO or other experts do not have these details) suggest we are missing:   

  • Case details (which cases) on 13 deaths (30% of fatalities)
  • 5 dates of onset 
  • Date of fatality in 1 known case 
  • 56 dates of hospitalisation 
  • 38 dates of discharge 
I am going to use a new term on VDU, to avoid "Case Fatality Ratio". Mine is being called the Proportion of Fatal Cases (PFC)[1]...just by me mind you!

The PFC is a percentage calculated as the currently known number of fatalities divided by the number of total lab-confirmed cases including fatalities, regardless of whether surviving cases are inpatients (hospitalized) or outpatients.

At writing, the current H7N9 PFC was 32.1%

The PFC is just a number - it's not meant to imply that it includes every case that ever happened (it never could) and does not account for those cases who will die directly or indirectly as a result of their infection later on, but who may be alive at the time of calculation. 


The PFC is a snapshot to be used before an outbreak is done and dusted. It is meant as a guide to what is happening right now using the data we can get our hands on. Sometimes that's lots of data (as it was with H7N9 - but has not been for a while now) or very limited data (as it is with MERS-CoV cases).

The
Case Fatality Ratio/Rate/Risk (CFR) makes use of the number of recovered cases in its denominator.[2] So it's important to know survivor numbers. As suggested above, this requires that all the people who will recover from their infection, have recovered (and been discharged) from their infection. 

Using the CFR early in an emerging virus/disease outbreak, when what usually brings in outbreak to our attention is death, is great for selling papers, but not helpful realistic in a bigger picture sense. 

The CFR is most useful at the end of an epidemic/pandemic, but not so much when data-in-hand is poor during the early days of many outbreak. 

Of course, some will take a PFC and multiply it by the world's population as an estimate of how many are going to die if the virus reaches pandemic levels. That's not helpful or accurate. Just accept it as that snapshot of what's happening now.

References...
  1. J. P. Dudley and I. M. Mackay. Age-Specific and Sex-Specific Morbidity and Mortality from Avian Influenza A(H7N9). J. Clin. Virol. 2013. Sept.
  2. http://en.wikipedia.org/wiki/Case_fatality_rate

Wednesday, 24 April 2013

A note on case fatality risk, rate or ratio (CFR)

..used in a couple of charts on the H7N9 page. This uses numbers based on very limited testing, publicly available data, recovered case numbers or understanding of the acquisition, transmission and clinical presentations associated with avian influenza A(H7N9) virus. 

It is very early days yet however I think this number gives you an idea of our understanding at the moment. It will undoubtedly change in the coming days, weeks and years. To be pedantic, the CFR relies uses the number of discharges/recovered cases as the denominator for the CFR. However, that will sensationally inflate the result. 

The CFR is often considered most useful at the end of an epidemic/pandemic, but less so when data-in-hand is limited such as during the early days of many outbreaks. Keeping in mind that some will take the CFR and multiply it by the world's population as an estimate of how many would die if the virus reached pandemic levels, I don't believe that approach is the best way to present the CFR metric for the emergence of a novel virus (usually first identified by the worst of the clinical presentations that will eventually be attributed to the virus). 

You won't see that usage on VDU, you will see the "rolling" version though. The US CDC definition is useful here.