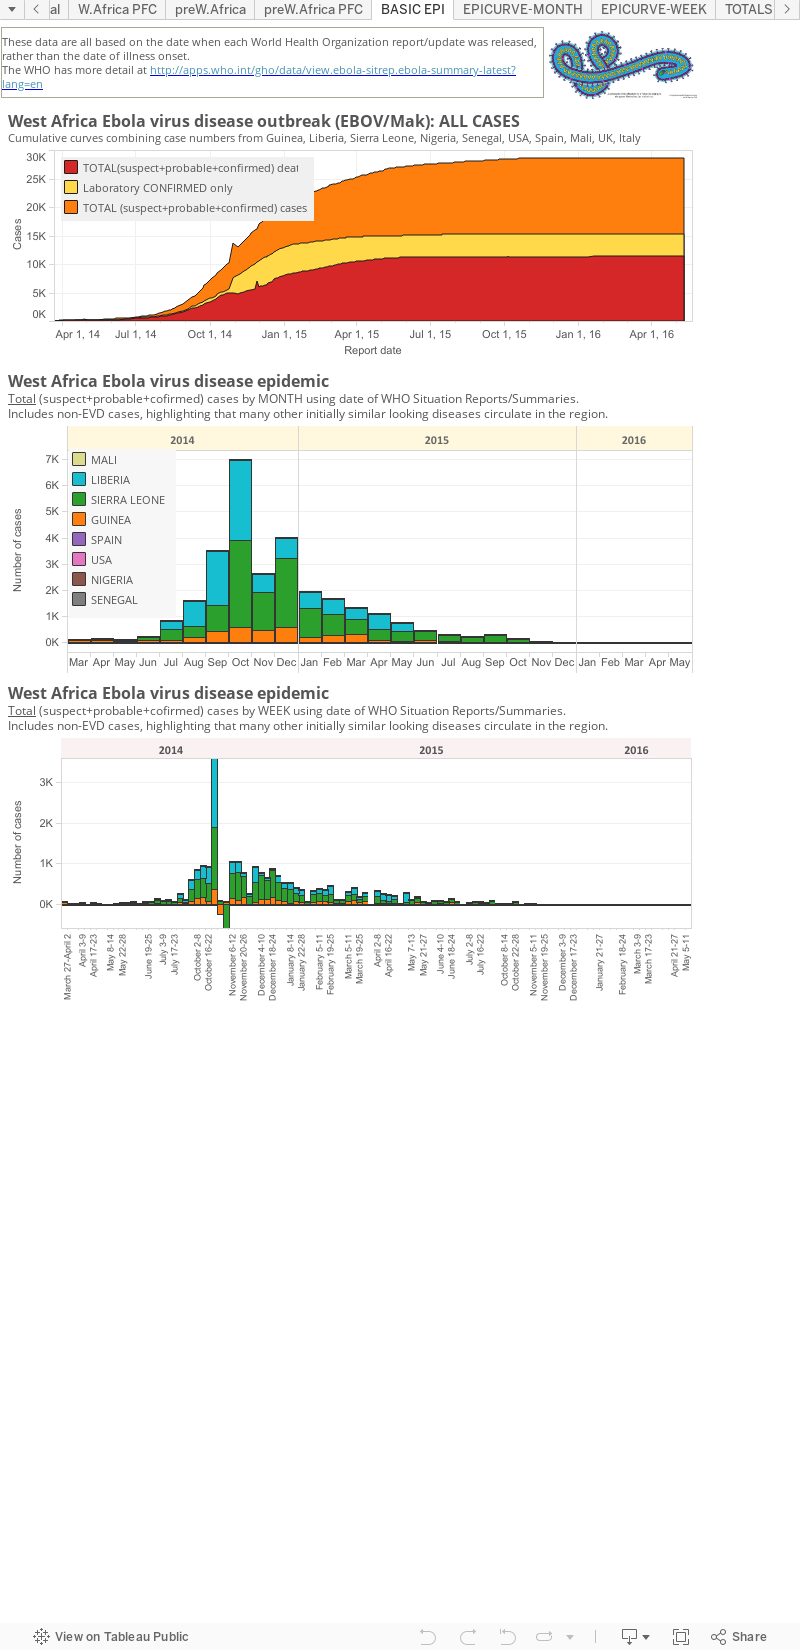
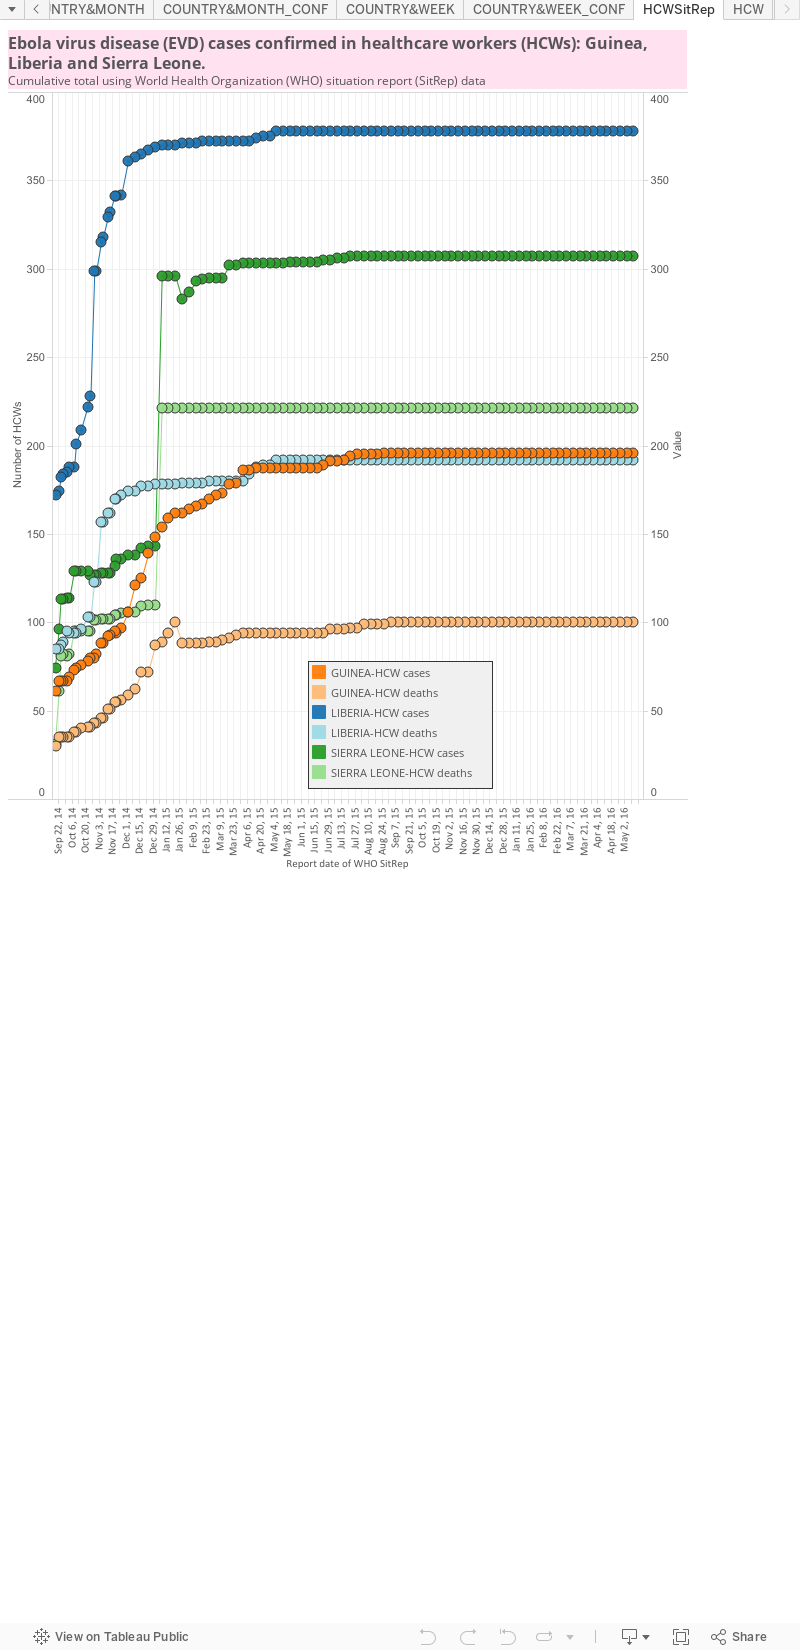
The WHO create multi-page Situation Reports [2] and brief Situation Summaries.[3] The SitRep's are currently presented on Wednesday and "additional updated figures" will be posted" a SitSumm when they become available any day of the week" (via eMail to journalists from WHO).
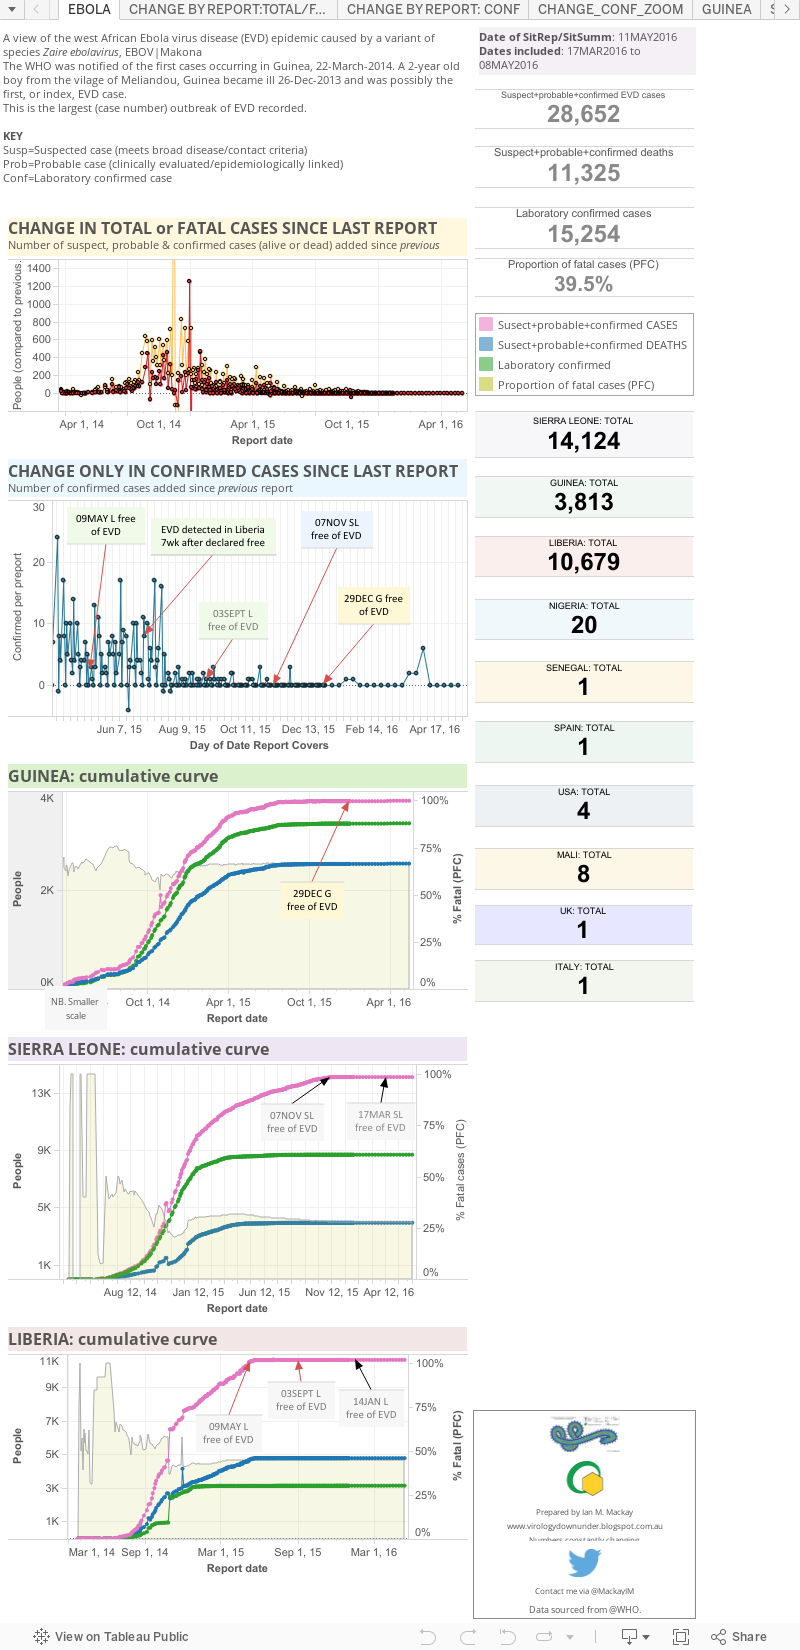
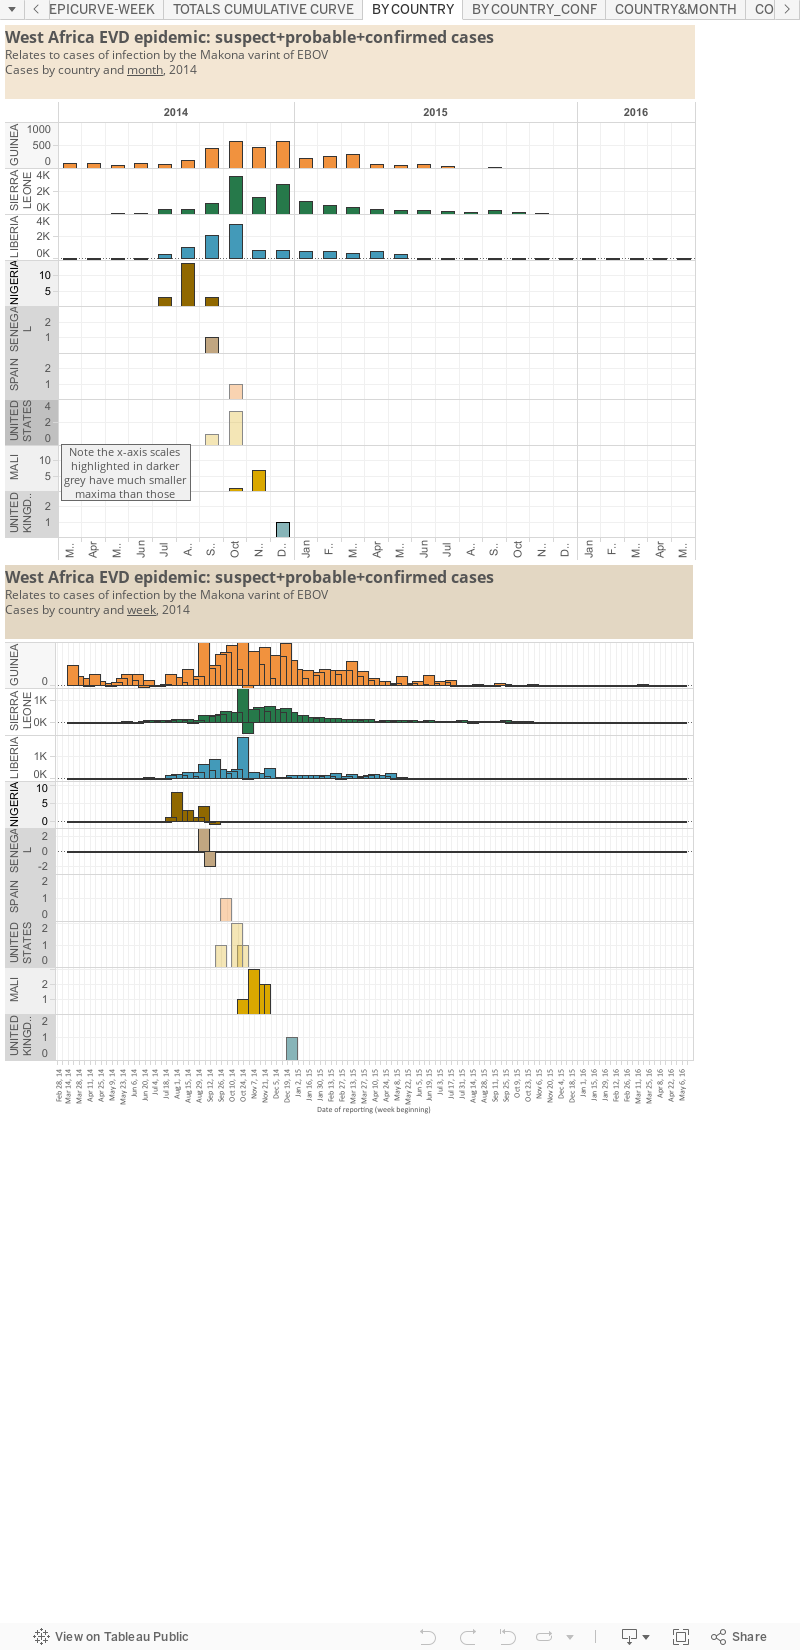
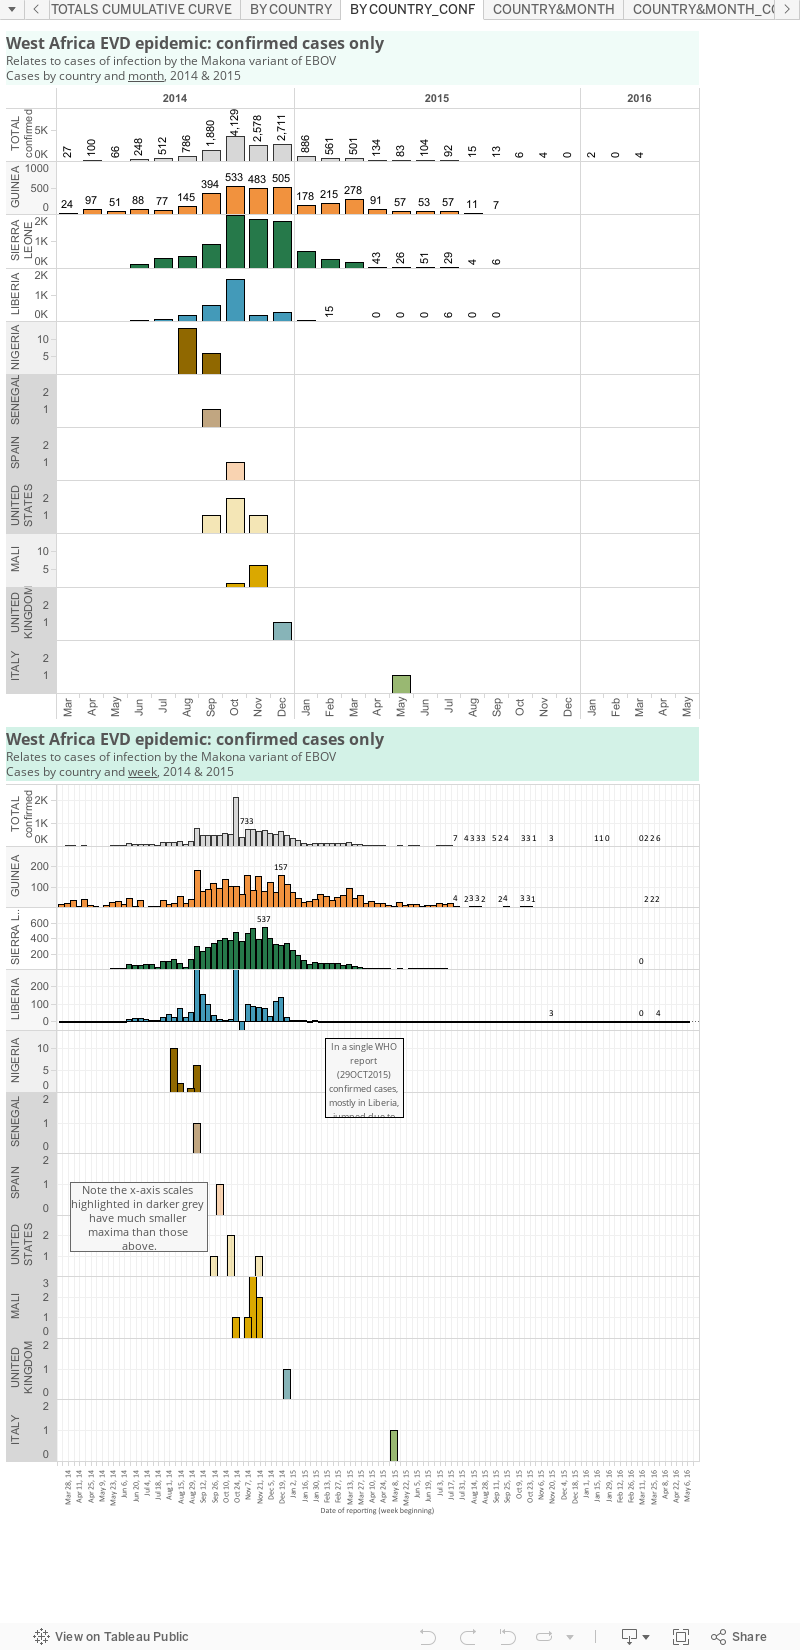
My totals include all countries that have hosted a case in, or sourced from, a West African nation. Countries include Guinea, Liberia, Sierra Leone, Nigeria (now EVD-free), Senegal (now EVD-free), the United States of America, Spain (now EVD-free), Mali (now EVD-free) and the United Kingdom. 'EVD-free means there are no known cases of EVD in the country. Some countries bring in cases of EVD to treat them; they can be defined as free of Ebola virus transmission, but not technically free of the EVD.
The West African region epidemic (top map below), including countries with imported cases and the totals from past Ebola virus disease outbreaks and the few imported monkey cases (the US & Philippines [hence zero human cases]) plotted by total numbers and country (bottom map).
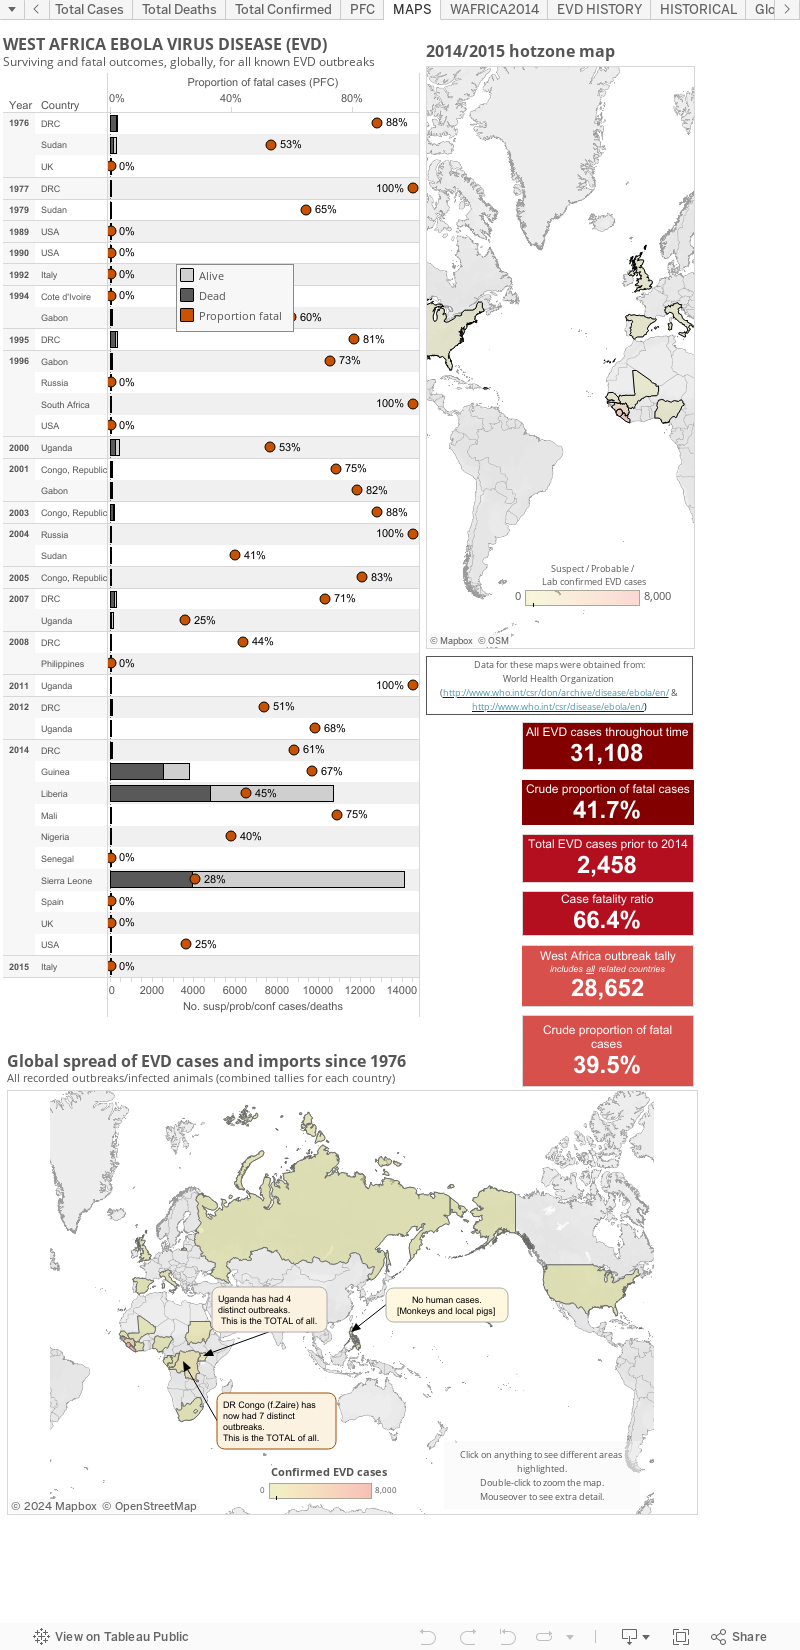
A note about the proportion of fatal cases (PFC): On these graphs, my PFC calculations for West African countries and the DRC are based on dividing the total number of suspected+probable+confirmed deaths by the number of total suspected+probable+confirmed cases on the same date. This is crude and is an underestimate of the true case fatality ratio (CFR) which has stood at ~70% throughout the epidemic.[2]
Reminders:
- The graphs above, as with all made by me VDU, are made for general interest only. It is also freely available for anyone's use, just cite the blog (http://virologydownunder.blogspot.com.au/) and me (Dr. Ian M Mackay, PhD) please. It may be that I have misinterpreted the language in the reports (sometimes a little tricky to wade through) or miscalculated some totals based on the way data have been presented.
- Sometimes there are very country-specific differences in what gets presented to/via the World WHO DONs/SitReps which make this process less clear than it could be. I recommend you have a read and compare the data from each of the countries for yourself to understand these issues.
- As I've talked about previously,[1] these numbers are all volatile for a variety of reasons, some Ebola-specific, so regard this chart for its trends only.
- I am only able to plot what is publicly available. To date, this does not include granular data with dates of onset, or daily data of any kind. The WHO have these data and you will see them become more available through their Situation Reports found here http://www.who.int/csr/disease/ebola/situation-reports/en/
- References...
- Ebola virus disease and lab testing...
http://virologydownunder.blogspot.com.au/2014/04/ebola-virus-disease-and-lab-testing.html - Ebola virus disease outbreak Situation Reports (SitRep)
http://apps.who.int/ebola/en/current-situation - Ebola virus disease outbreak Situation Summaries (SitSumm)
http://apps.who.int/gho/data/view.ebola-sitrep.ebola-summary-latest?lang=en
- Ebola virus disease and lab testing...
No comments:
Post a Comment
Note: only a member of this blog may post a comment.