Showing posts with label map. Show all posts

Wednesday, 21 September 2016

The reach of Aedes aegypti in Queensland, Australia...

I made this, based on the State of Queensland,(Queensland Health) map from the 2015-2020 Queensland Dengue Management plan.[1] 

Feel free to use this image but please abide by the copyright 
notice found within the 2015-2020 Queensland Dengue management plan.[1]
Click on map to enlarge.
The map may be a useful accompaniment to the recent paper confirming Aedes aegypti is the most likely mosquito vector of Zika virus (ZIKV) in Australia.[2]

While Australia does have these mozzies, it does not have local ZIKV transmission and Dengue is not endemic in Queensland. 

Annual local outbreaks of Dengue do occur in Queensland but these result from imported cases and are confined to north Queensland.[1]

I've added in some other map-related information to the reference section as well.[3,4,5,6]

References...

  1. 2015-2020 Queensland Dengue management plan, Queensland Government.
    https://www.health.qld.gov.au/publications/clinical-practice/guidelines-procedures/diseases-infection/governance/dengue-mgt-plan.pdf
  2. Assessment of Local Mosquito Species Incriminates Aedes aegypti as the Potential Vector of Zika Virus in Australia
    http://journals.plos.org/plosntds/article?id=10.1371/journal.pntd.0004959
  3. Dengue and climate change in Australia: predictions for the future should incorporate knowledge from the past
    https://www.mja.com.au/journal/2009/190/5/dengue-and-climate-change-australia-predictions-future-should-incorporate?0=ip_login_no_cache%3D20128744c69e384fe459a669360e8b29
  4. “Dengue” mosquitoes detected in Melbourne: What does it mean?
    https://cameronwebb.wordpress.com/2014/03/16/dengue-mosquitoes-detected-in-melbourne-what-does-it-mean/
  5. The Extinction of Dengue through Natural Vulnerability of Its Vectors
    http://journals.plos.org/plosntds/article/asset?id=10.1371/journal.pntd.0000922.PDF

Thursday, 15 September 2016

Middle East respiratory syndrome coronavirus (MERS-CoV) hotzone map gets a paint job..

A slightly updated MERS-CoV map adding in some camel detection sites in Africa and changing up the colours.

27 countries have been visited - 13 have had local transmission.

And there have been 2 humans in Kenya found to harbour antibodies to MERS-CoV. This helps address the question of why we hadn't seen human MERS cases in Africa despite countries harbouring MERS-CoV infected dromedary camels. The answer of course is, we hadn't looked.

Click on image to enlarge

Tuesday, 17 May 2016

27 countries have seen a MERS-CoV case with Bahrain's addition...

13 of those 27 have had local transmission.

The Bahrain-diagnosed infection was likley acquired from a camel in his dromedary camel farm in Saudi Arabia.

Click to enlarge.

Friday, 18 September 2015

MERS around the world...

China was the 26th country to host a MERS-CoV infected person, when a 44-year old symptomatic male (onset 21-May-2015) travelled from South Korea, through Hong Kong to Huizhou in Guangdong Province,  China on 26-May-2015.[1] 

Click on it!
It gets bigger!!!
Reference...

  1. http://www.who.int/csr/don/30-may-2015-mers-china/en/

Monday, 8 June 2015

Middle East respiratory syndrome coronavirus (MERS-CoV): unhappy trails...

An updated map of the countries that have had a visit from, and in 52% of those, had some local transmission of, the MERS-CoV.

South Korea is the first country I have seen that has jumped three colour levels between updates. No mean feat.

So we have 25 countries that have hosted a MERS-CoV infected person, and 13 of those have gone on to have local transmission - new cases from that case on their soil.

Click on it!
It gets bigger!!!
In the meantime, 7,000,000 pilgrims are expected in Saudi Arabia to perform Umrah between mid-May (around the 19th May) and mid-July.[1] Over 2,000,000 had already performed the Umrah pilgrimage to The Holy City of  Makkah in Makkah province, between November 2014 and May 2015.[1,2] We're in the second phase of Umrah now - in the lead-up to the fasting month of Ramadan which begins on the 18th June 2015. 

Remember Saudi Arabia? That's where over 80% of all MERS-CoV cases have originated. That percentage has dropped a little of late thanks to the clusters in South Korea. Given the amazingly, incredibly, ultra-tiny (yes, that small) number of cases that have reportedly arisen during Umrah or Hajj (Septembee 21-26 in 2015)  in previous years, there is absolutely no reason to think 2015 will differ. Even if there have been recent cases in Makkah province. And a hospital cluster in Ash Sharqiyah (eastern province).

Clearly, MERS-CoV is not easy to catch even when so many different people, so many different states of underlying chronic disease, immune compromise, pre-existing infection, height, weight, age all come into contact within the zone of hotness that is Saudi Arabia.  

Which leaves me with one comment after a large batch of 23 cases was announced this morning - bringing the total to 87 from South Korea....look to the infection control South Korea!

References..

  1. http://english.alarabiya.net/en/News/middle-east/2015/05/19/7-million-Umrah-pilgrims-expected-in-Saudi-in-next-2-months.html
  2. http://english.alarabiya.net/en/News/middle-east/2015/01/28/Over-one-million-Umrah-pilgrims-pass-through-Jeddah.html

Monday, 4 May 2015

Hubei province listed its first H7N9 case in April...some rare detail

A new province was recently added to the list of those reporting cases of avian influenza A(H7N9) virus infection in humans. 

Of course reporting does not mean capturing. Reporting has been weak this season. The cases that have shown seem to be just those who were ill enough to visit a Doctor/hospital and get a laboratory test. This is the same story for most infectious agents. We see just the tip of the iceberg, the beginning, the head of the arrow, we only scratch the surface, the glycoprotein on the envelope of the virus as it leaves the...okay, you get the picture.

This year has seen a very disappointing effort by China to provide useful public data that could permit tracking of what has become the annual outbreak of human cases of avian influenza A(H7N9) virus infection.

The human H7N9 case hotzone, at least since we heard about the virus infecting a human in February of 2013, have been on the east coast of China. We currently stand at 659 reported human cases, and over 200 deaths. Very. Roughly.

Click on image to enlarge.

I remember fondly a time when there were scads of data on H7N9-related human cases and deaths. Okay, China did over-share on a number of occasions....

Click on image to enlarge.
Story to be found here.
Click on image to enlarge. 
Story to be found here.
Click on image to enlarge. 
Story to be found here.

..but things have changed. 

For a comparison take the Kingdom of Saudi Arabia's Ministry of Health and their efforts to provide public data on Middle East respiratory syndrome (MERS) and its coronavirus (MERS-CoV). While there are a few gaping holes in the data set (c'mon guys-fill these in!), there can be as many typos as on this blog (but I'm not a public health Ministry - in case you were wondering) and the data can be intermittent, it represents the best public source of detailed, yet deidentified, human data on an ongoing zoonotic viral emergence. And that's saying something. But congratulations nonetheless!

I'm not including Ebola virus disease data-gathering here - the fact that we have had so much data - despite the initial lack of infrastructure and people trained to collect, collate and report that detail - is a fantastic testament to the efforts of those on the ground in Guinea, Sierra Leone and Liberia.

But this season H7N9 data that have been reported by public health sources have been released in blocks and lack any consistent or useful detail, except the province. Some detail is available when harvested from media reports by the ever assembled FluTrackers team. I rely heavily on their line list (to be found here). 

One example of the poor data quality this season, take a look at this text from a recent Disease Outbreak News provided by BigBlue (that's the World Health Organization, or WHO, for those not accustomed to my street groove)... 


No-one will be reading that and feel overly informed.

One is left to assume that this is how these data are coming out of China - infrequently and without detail. We regularly see that when better data are provided - and again, I hold up MERS-CoV case descriptions here - they get publicly listed by BigBlue. 

And before you head to your keyboard to ask "Why should we have access to these data?"...I will first ask you - why shouldn't we? They are collected and collated internally. They are of interest to epidemiologists, model builders, public health planners and data tinkerers the world over. And it's not as though the details are subsequently released in peer-reviewed publications. They are not. 

It's just disappointing.

Tuesday, 5 August 2014

MERS-CoV: maps, totals, sex, age and different populations

This post has been moved to the new Virology Down Under platform on WordPress.

You can access this post by clicking the link below.
 
https://virologydownunder.com/mers-numbers/

Please adjust your bookmarks.

Apologies for any inconvenience.

Sunday, 20 July 2014

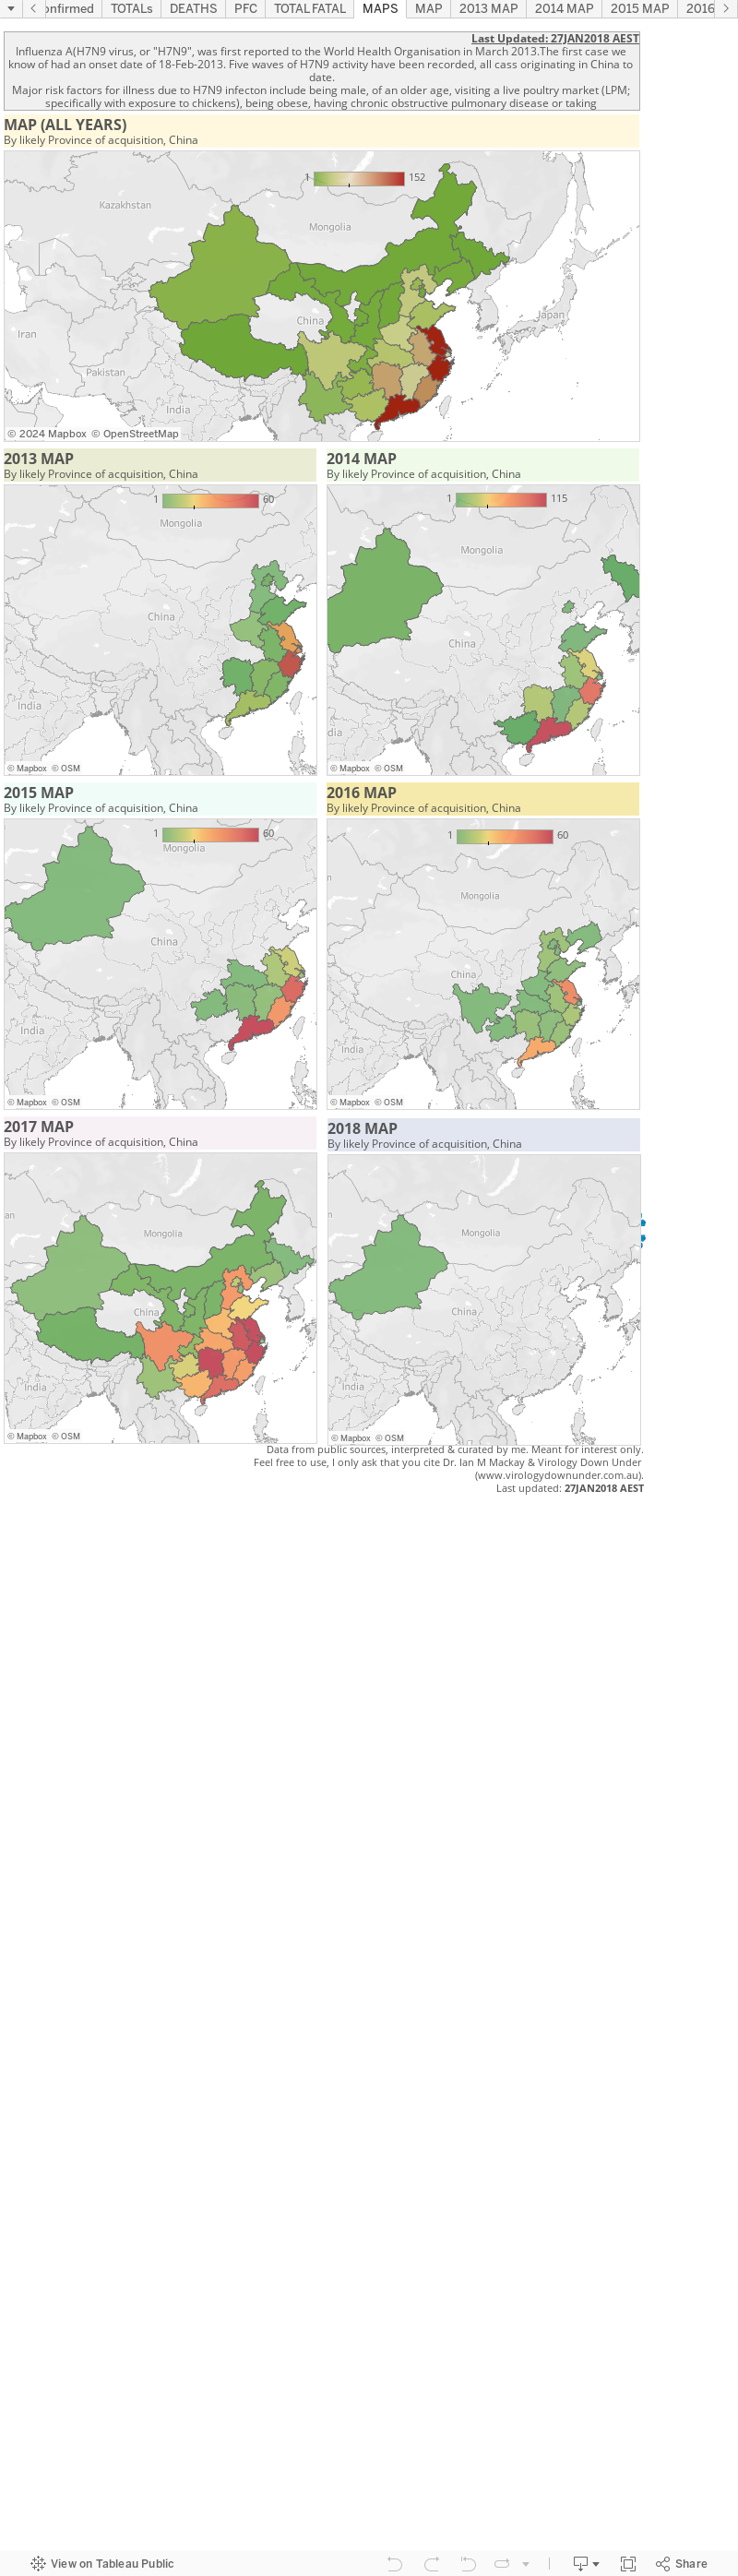
Now for something (not so) completely different: H7N9 maps...

Now it's time to mess around with influenza A(H7N9) virus mapping using Tableau.

I've (only just) realised the my esteemed peer, Shane Granger has been using Tableau to do this for ages (see here), and that this will be duplicating his excellent work. So I'll try my best to consciously differentiate my maps from his - but there's only so far you can go with that and there will be overlap. 

The page below is a very early first play with H7N9. It's just detections broken across 2013 and 2014, by province most likely to have been the source of the infections (as far as I can tell) in mainland China. 

If I can master this I'll try and add more details in the future. For now, these numbers a a little out of date but he trends are similar. This charts 449/452 detections.


Thursday, 10 July 2014

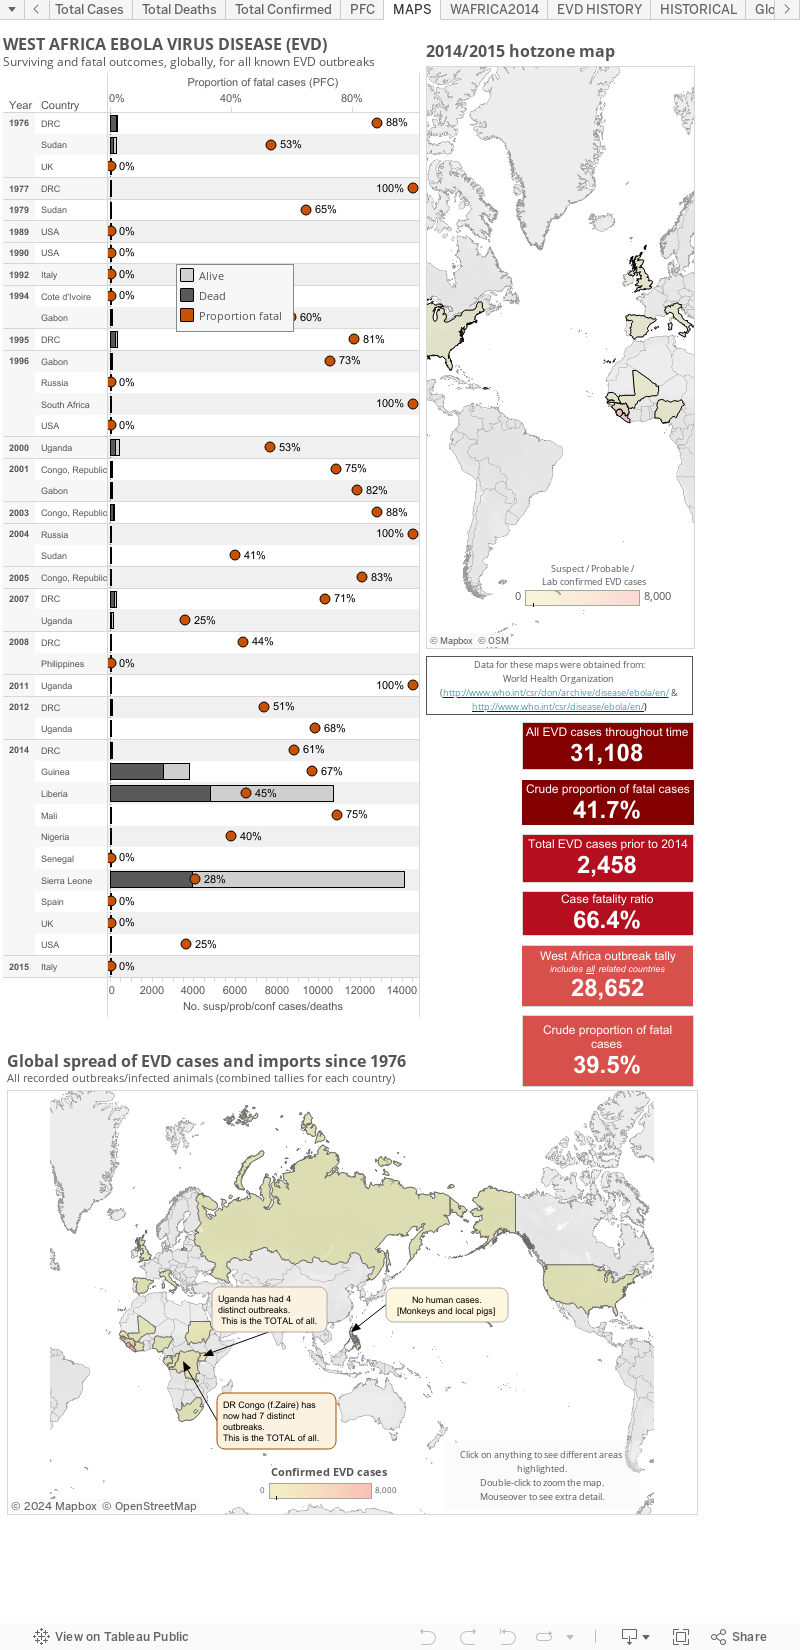
Ebola virus disease (EVD) cases, clusters and outbreaks mapped out...

The West African region epidemic (top map), including countries with imported cases and the totals from past Ebola virus disease outbreaks and the few imported monkey cases (the US & Philippines [hence zero human cases]) plotted by total numbers and country (bottom map).

These maps are best viewed alongside my Ebola virus disease numbers page found here.


The WHO create multi-page Situation Reports [2] and brief Situation Summaries.[3] They are currently presented on Wednesday and "additional updated figures" will be posted "as they become available any day of the week" (via eMail to journalists from WHO).

My totals include all countries that have hosted a case in, or sourced from, a West African nation. Countries include Guinea, Liberia, Sierra Leone, Nigeria (now EVD-free), Senegal (now EVD-free), the United States of America, Spain and Mali.

This is a static page but as of 21-Jan-2015 (AEST) I have copied the maps to the bottom of my main EVD EBOV|Makona (west African Zaire ebolavirus variant) outbreak page at:  http://virologydownunder.blogspot.com.au/2014/07/ebola-virus-disease-evd-2014-west.html


A note about the proportion of fatal cases (PFC): 
On these graphs, my PFC calculations for West African countries and the DRC are based on dividing the total number of suspect/probable/confirmed deaths by the number of total suspect/probable/confirmed cases for the same date. This is crude and may be a sizable underestimate of the true PFC.

It may be better to use the deaths at the most recent date divided by the total cases from 9-16-days  earlier (this number is not precisely known) to better account for the lag in time between presenting to a treatment facility and dying (for those who do not recover). 


Some estimates suggest the true PFC may be closer to 70%-80%. I don't have enough data (or smarts) to be able to calculate the lag for now so please be aware that the PFC above is likely an underestimate.


  • The figure above, as with all on VDU, is made for general interest only. It is also freely available for anyone's use, just cite the page and me (Dr. Ian M Mackay, PhD) please. It may be that I have misinterpreted the language in the reports (sometimes a little tricky to wade through) or miscalculated some totals based on the way data have been presented. 
  • Sometimes there are very country-specific differences in what gets presented to/via the World WHO DONs/SitReps which make this process less clear than it could be. I recommend you have a read and compare the data from each of the countries for yourself to understand these issues. 
  • As I've talked about previously,[1] these numbers are all volatile for a variety of reasons, some Ebola-specific, so regard this chart for its trends only.
  • I am only able to plot what is publicly available. To date, this does not include granular data with dates of onset, or daily data of any kind. The WHO have these data and you will see them become more available through their Situation Reports found here http://www.who.int/csr/disease/ebola/situation-reports/en/
References... 
  1. Ebola virus disease and lab testing...
    http://virologydownunder.blogspot.com.au/2014/04/ebola-virus-disease-and-lab-testing.html
  2. Ebola virus disease outbreak Situation Reports (SitRep)
    http://www.who.int/csr/disease/ebola/situation-reports/en/
  3. Ebola virus disease outbreak Situation Summaries (SitSumm)
    http://apps.who.int/gho/data/view.ebola-sitrep.ebola-summary-latest?lang=en

Monday, 7 July 2014

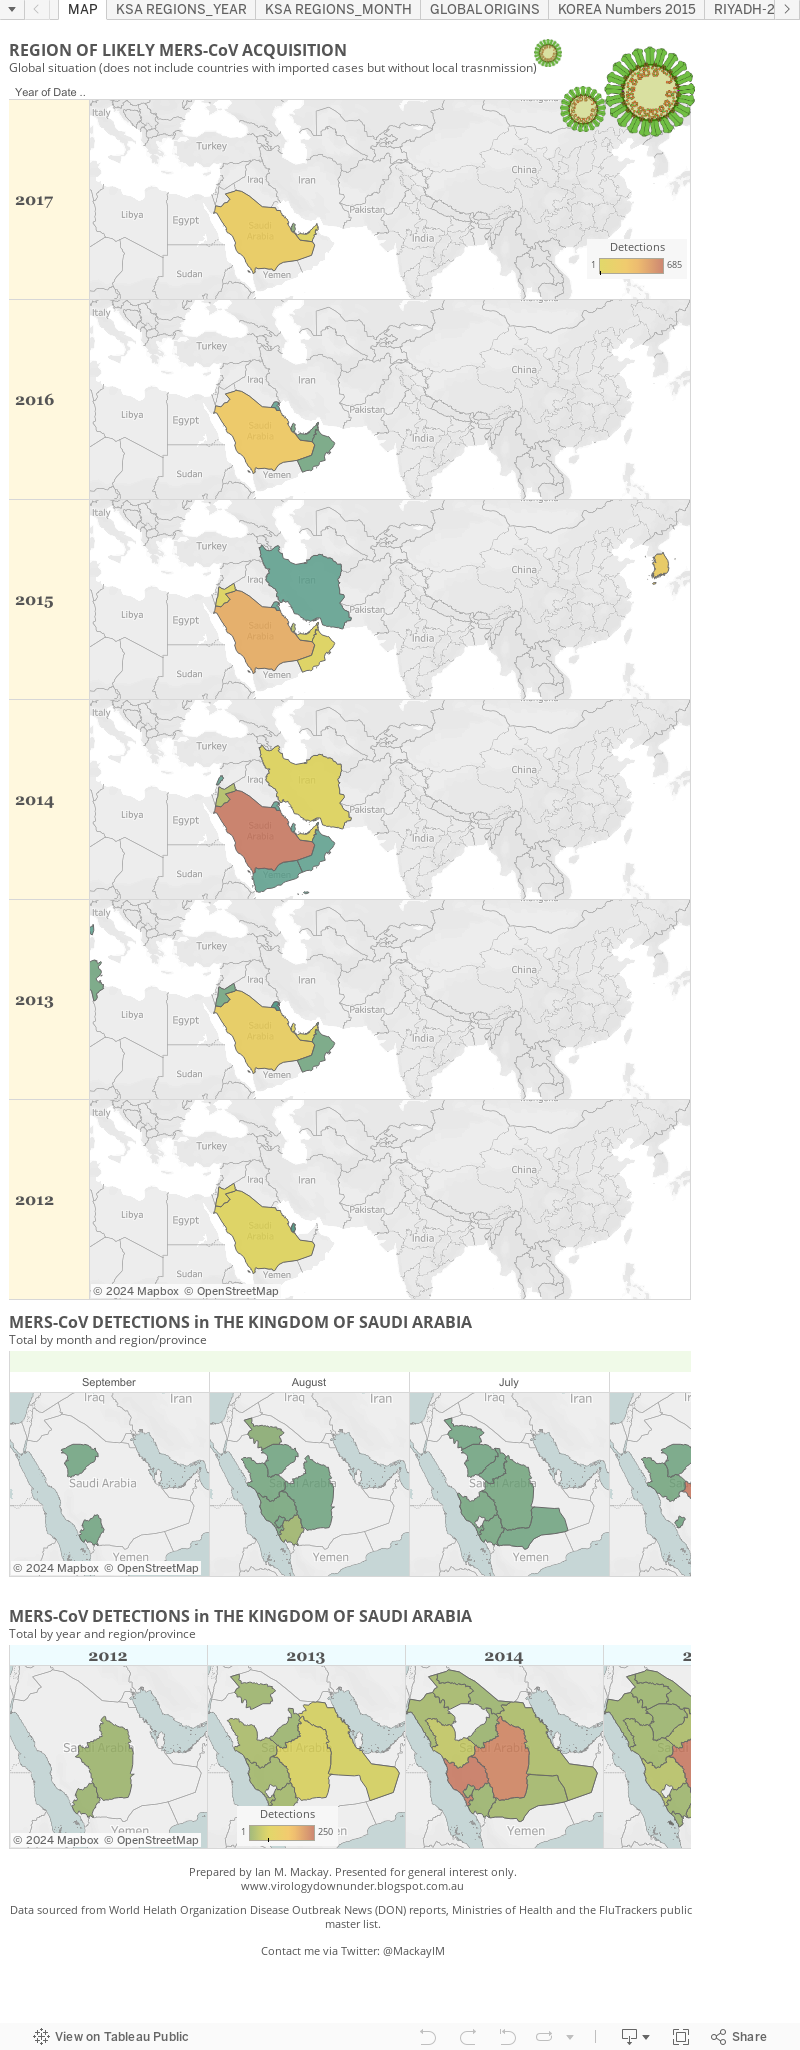
Mucking about with MERS and maps...

Yes, some more of that stuff with the Tableau presentation stuff.

This one shows the MERS-CoV cases on a map by the region they were most likely acquired in. So that means it doesn't show all the site to which cases arrived via export, just their likeliest point of origin.

Because we have no individual case details about the 113 "found" Saudi Arabian cases from 3-June, I've taken some liberties using the hints provided by the World Health Organization to put this figure together. It will be a little out on the (29) of the found113 that occurred between 5 May 2013 and 28 February 2014 but its the best I can manage with that big data gap.


MERS-CoV in June/July...

Looks like MERS-CoV cases, while few in number, remain well distributed across nearly all of the Kingdom of Saudi Arabia still.

With such a remarkably widespread distribution one must ask, where are these cases coming from? In the absence of any noted hospital outbreaks, do we assume that they are all from animal>>human acquisition?

And what is it about Ha'il, Jizan and Qasim provinces that are protecting them during this period?

Middle East respiratory syndrome coronavirus activity in June and July in the Kingdom of Saudi Arabia. The pale orange regions have had cases noted, Only Ha'il, Jizan and Qasim provinces have not yielded any MERS-CoV detections.
Click on map to enlarge.

Friday, 4 July 2014

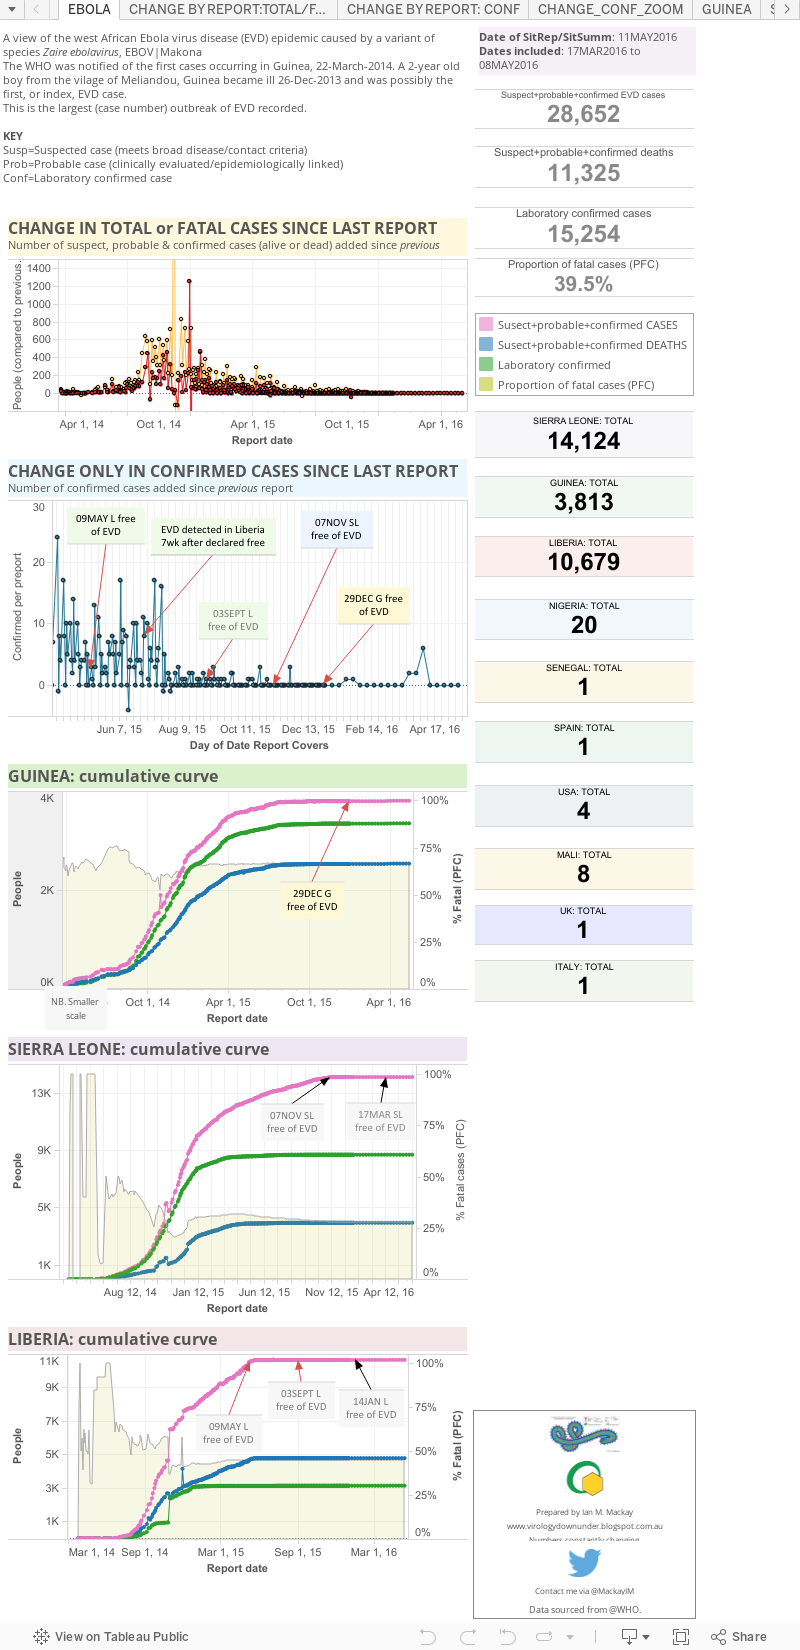
Ebola virus disease (EVD) 2014 West African outbreak..

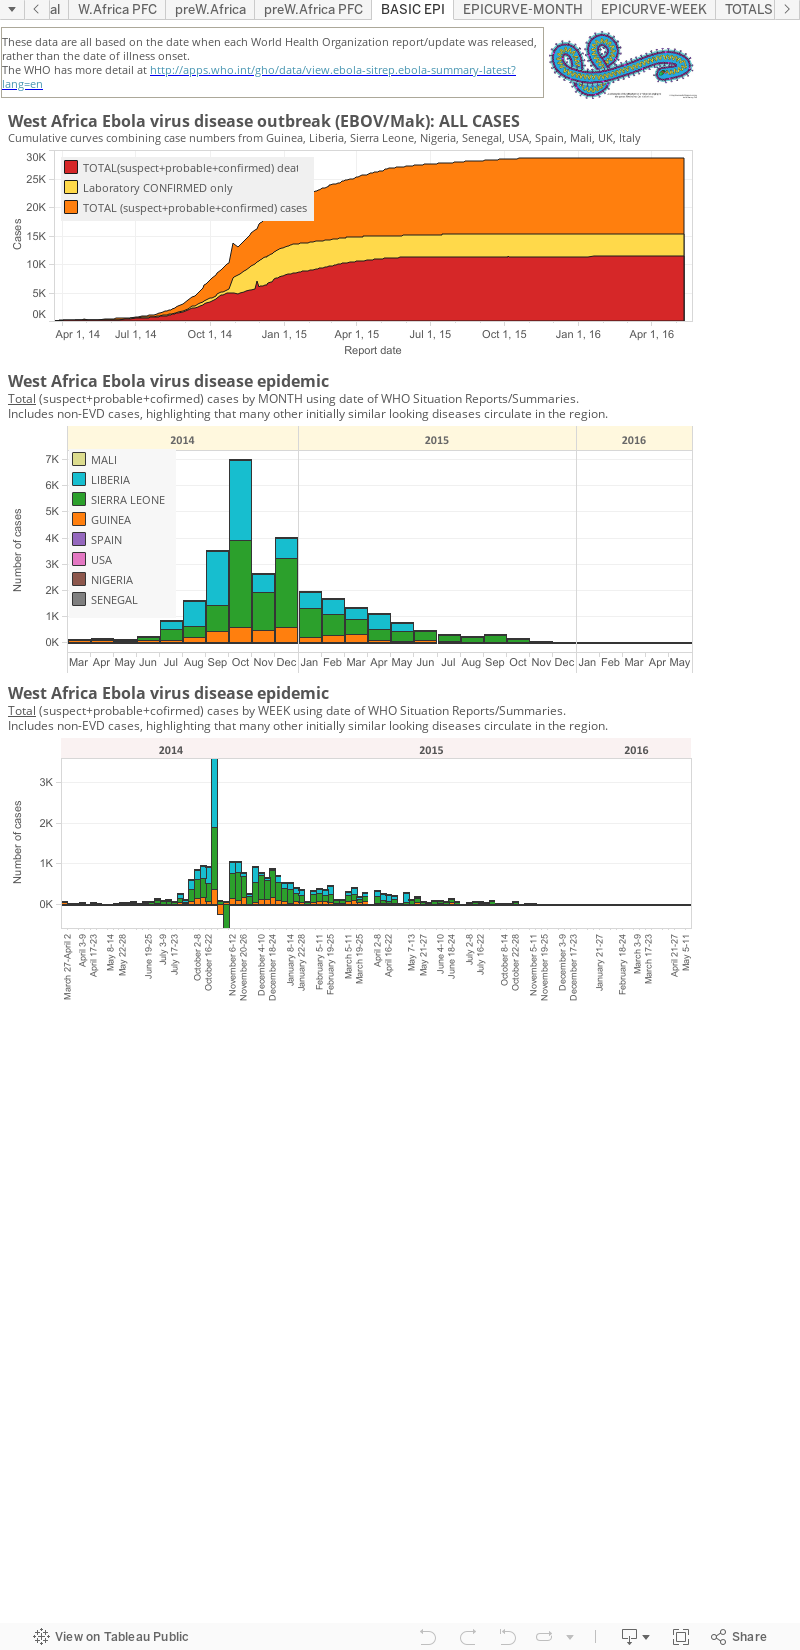
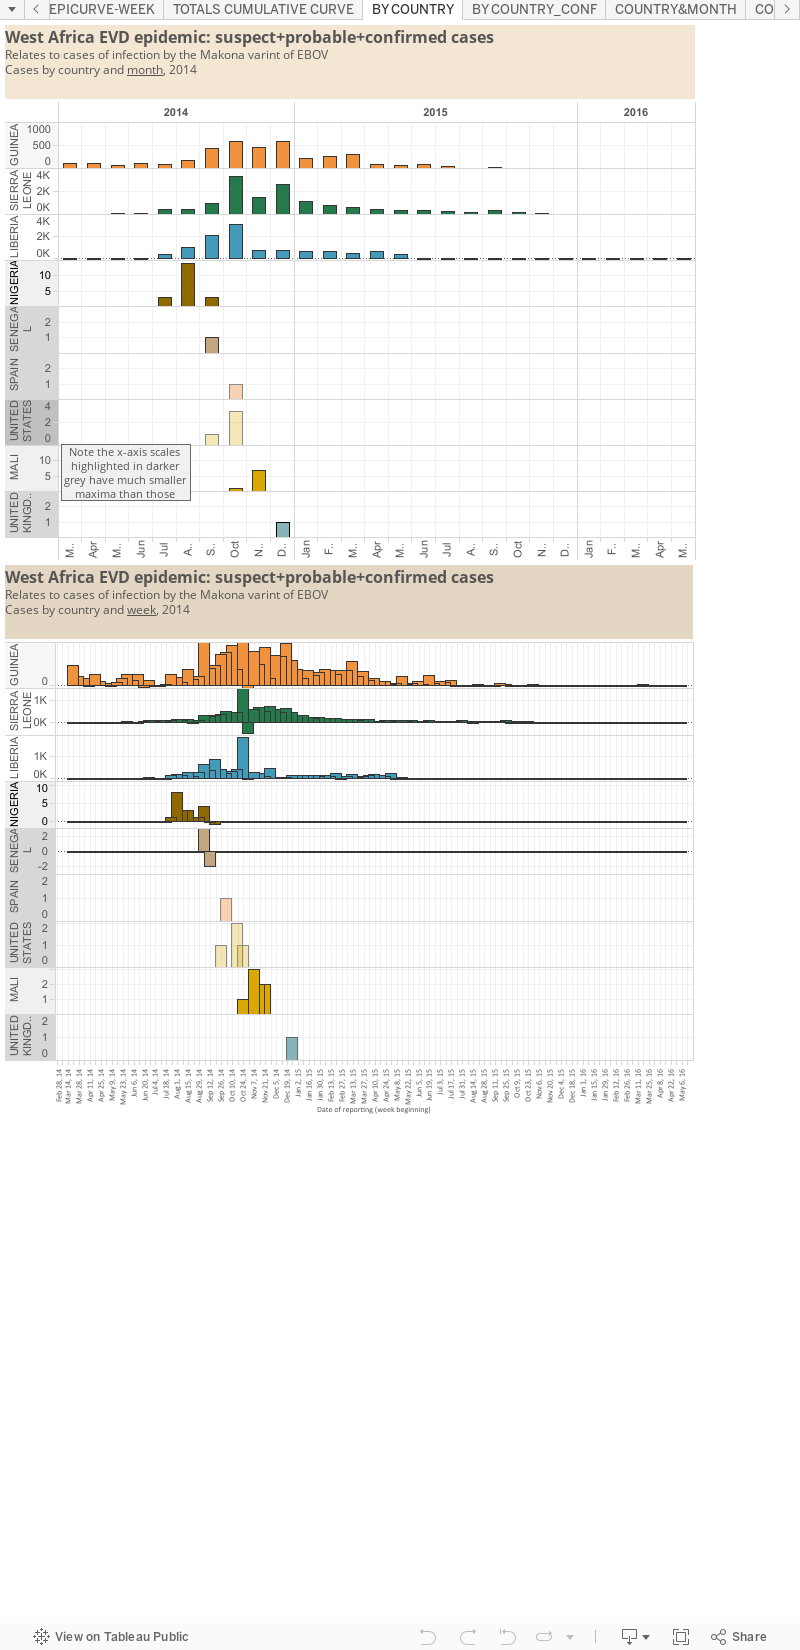
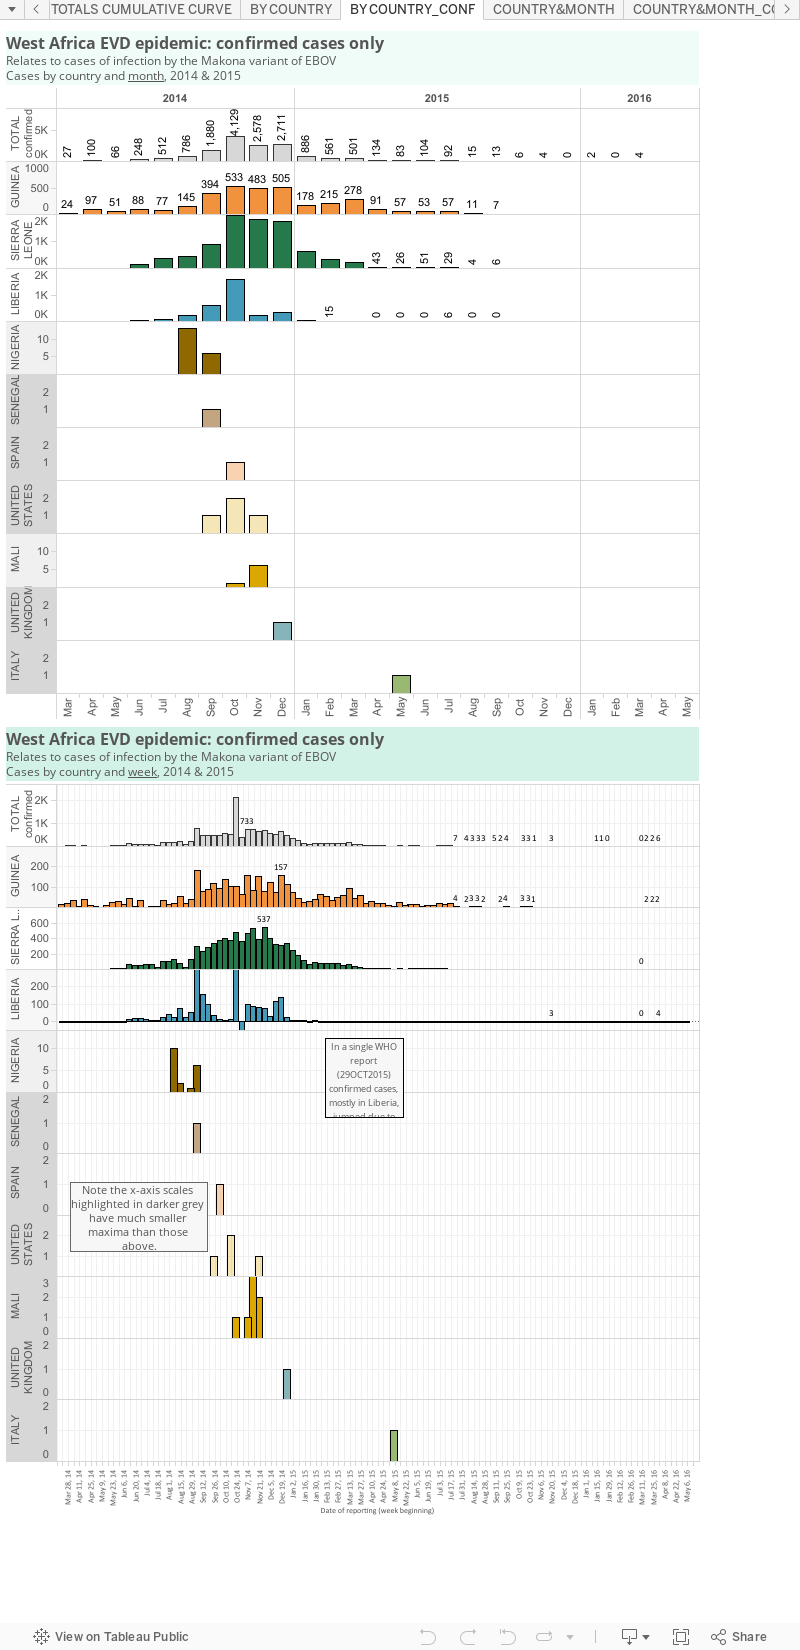
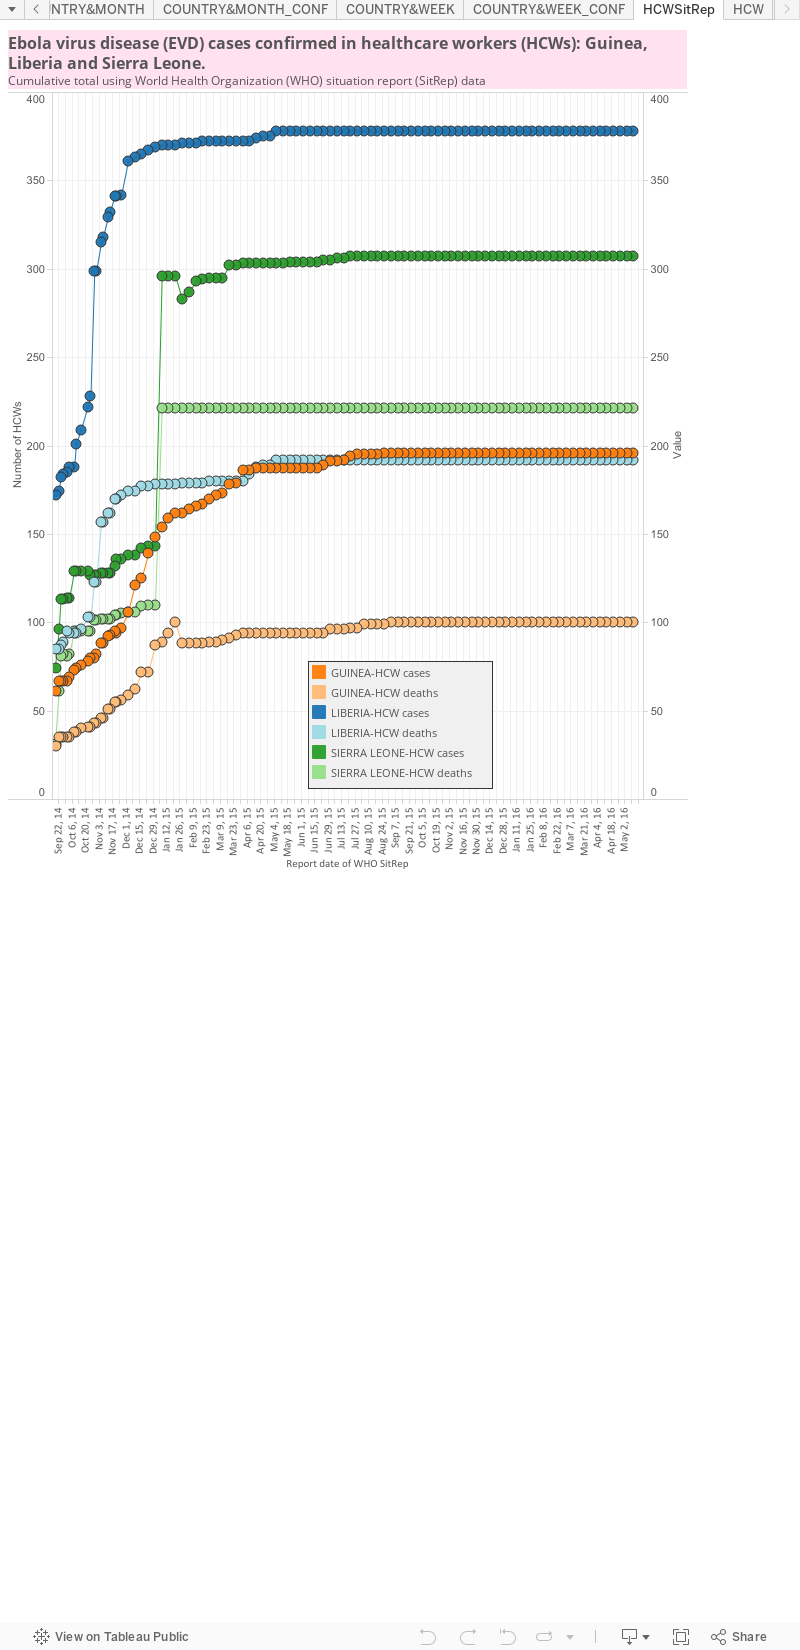
I will update this static page (link won't change so you can bookmark it) with the 2014 West African Ebola virus disease (EVD) numbers after they are released by the World Health Organization (WHO). The date these graphs were last updated is listed at the top of the first panel or "dashboard" of graphs an totals .

The WHO create multi-page Situation Reports [2] and brief Situation Summaries.[3] The SitRep's are currently presented on Wednesday and "additional updated figures" will be posted" a SitSumm when they become available any day of the week" (via eMail to journalists from WHO).


My totals include all
 countries that have hosted a case in, or sourced from, a West African nation. Countries include Guinea, Liberia, Sierra Leone, Nigeria (now EVD-free), Senegal (now EVD-free), the United States of America, Spain (now EVD-free), Mali (now EVD-free) and the United Kingdom. 'EVD-free means there are no known cases of EVD in the country. Some countries bring in cases of EVD to treat them; they can be defined as free of Ebola virus transmission, but not technically free of the EVD.


The West African region epidemic (top map below), including countries with imported cases and the totals from past Ebola virus disease outbreaks and the few imported monkey cases (the US & Philippines [hence zero human cases]) plotted by total numbers and country (bottom map).


A note about the proportion of fatal cases (PFC): On these graphs, my PFC calculations for West African countries and the DRC are based on dividing the total number of suspected+probable+confirmed deaths by the number of total suspected+probable+confirmed cases on the same date. This is crude and is an underestimate of the true case fatality ratio (CFR) which has stood at ~70% throughout the epidemic.[2]

Reminders: 

  • The graphs above, as with all made by me VDU, are made for general interest only. It is also freely available for anyone's use, just cite the blog (http://virologydownunder.blogspot.com.au/) and me (Dr. Ian M Mackay, PhD) please. It may be that I have misinterpreted the language in the reports (sometimes a little tricky to wade through) or miscalculated some totals based on the way data have been presented. 
  • Sometimes there are very country-specific differences in what gets presented to/via the World WHO DONs/SitReps which make this process less clear than it could be. I recommend you have a read and compare the data from each of the countries for yourself to understand these issues.
  • As I've talked about previously,[1] these numbers are all volatile for a variety of reasons, some Ebola-specific, so regard this chart for its trends only.
  • I am only able to plot what is publicly available. To date, this does not include granular data with dates of onset, or daily data of any kind. The WHO have these data and you will see them become more available through their Situation Reports found here http://www.who.int/csr/disease/ebola/situation-reports/en/ 
  1. References... 
    1. Ebola virus disease and lab testing...
      http://virologydownunder.blogspot.com.au/2014/04/ebola-virus-disease-and-lab-testing.html
    2. Ebola virus disease outbreak Situation Reports (SitRep)
      http://apps.who.int/ebola/en/current-situation
    3. Ebola virus disease outbreak Situation Summaries (SitSumm)
      http://apps.who.int/gho/data/view.ebola-sitrep.ebola-summary-latest?lang=en

Friday, 9 May 2014

Snapdate: MERS-CoV by date 20-Apr:08-May [UPDATED]

With the addition of a new country, Lebanon, the 18th to host an imported or locally acquired laboratory confirmed MERS-CoV-positive, I've updated the world map below. 
Click on map to enlarge. It needs it!
I've also had a quick look at cases per day for some (but not all) recent detections of the MERS-CoV, based on the dates we have to work with. 

It certainly looks like case numbers are dropping slowly. 


Click on image to enlarge.
Having more dates of onset has helped to re-assign when people actually became ill, an important piece of the transmission puzzle for tracking the Jeddah-based outbreak. Onset is my date of choice - when it's available. 

We no longer know, or can't calculate using public data;

  1. When a death/recovered person is first identified. The Kingdom of Saudi Arabia (KSA) Ministry of Health (MOH) reports do not include any deliberate link between age/location of death/recovery they now note, and date the case was originally reported/became ill/was hospitalized. Any of those would be a Rosetta stone to decode the link. Apart from a "total dead/recovered" tally, having only partial information on death/recovery is another missed opportunity to be clear.
  2. Profession of the infected person. Just in broad categories, as we saw from China for H7N9 earlier on (not so much now). Healthcare worker detail has disappeared with no communication about whether this is due to an actual drop in such cases or not. Some assume it means we're just no longer being told this information. But a recent Filipino HCW (h/t @lisaschnirring) was reported back home as having died, yet HCW does not seem to have been listed on relevant KSA MOH report supporting the worries of the some.
  3. Homeland.  Is the infected person a KSA citizen, expatriate worker, pilgrim for umrah (or hajj later this year) a traveler for business or for pleasure?
  4. Links for contacts. We get told of contacts with previous cases but no linkage detail is provided.
  5. Respiratory symptoms may be mentioned as a reason for hospitalization (which is dated) but the date of onset (DOO) of these symptoms is sometimes not provided. DOO is the currency of good basic epidemiology in my opinion. Its gold, diamonds and platinum. It's chocolate (okay, that's just my currency). This data will occur for some cases but not for others, even within a single MOH announcement.
  6. Animal contact. No longer to we get mentions about exposure (be that to airborne or ingested virus) to camels/animals/farms. Add festivals to that.
  7. Date of laboratory testing. This isn't available for prodromal/asymptomatic people. They would be best identified using the date of testing - but since the MOH doesn't tell us the date of testing, I use the date of reporting. That might be anywhere from 1-day to 2-weeks after actual testing. 
  8. Nosocomial (hospital-acquired) MERS-CoV infection. Reliable dates would help identify these. This is available sometimes, but inconsistently. Relates to both #5 and #7 This is also confounded by the recent removal of hospital names, presumably to avoid panic and save face by not broadcasting the names of facilities with continued poor control of MERS-CoV spread.
I know that by saying "providing half-baked data is tantamount to providing no data at all", the intent could be changed and instead used to say "okay, then lets provide no data at all". Hopefully charts like mine and others and our commentaries do not serve to focus the MOH gaze on what to remove from the data that have draw our ire, but instead provide a service to help hone the message by stopping up data gaps and oversights. 

Endemic communication timidity and inconsistencies have been a hallmark of the emergence of MERS and the MERS-CoV. They only serve to promote anxiety and attempts by talking heads (like myself) to fill such information voids with guesses, the overuse of CAPITAL LETTERS and just plain vacuous garbage.

As ProMED put it in an email to its membership today in relation to Polio (and in seeking some funds to keep running which you can help with by donating here)..
"...the notion that gathering data and sharing it freely is in the best interests of everyone's health. Vigilant surveillance remains the best strategy for rapid response.."
'Nuff said.

Thanks to @HelenBranswell for further additions.

Friday, 21 February 2014

H7N9 appears in a new north eastern Chinese province: Jilin

Click on image to enlarge.
...and the map expands a little more. 

It would be interesting to know if this case was acquired from a live poultry market stocked with birds sourced within the province or from the vast network of poultry movement that links the provinces and their markets across thousands of kilometres.

As I write this, there are 365 cases and 113 deaths, if I can add the latest Guangdong fatality to the 112 I wrote about, earlier today.

Thursday, 6 February 2014

H7N9 snapdate: hotspot map

Click on image to enlarge.
Modified from here.  
Guangdong province starts to see red while Guangxi very quickly moved from 1 case to 3.

Activity in China's north east remains low.

Saturday, 11 January 2014

Influenza A (H7N9) hotspot map updated: 164 cases...


The latest hotspot map showing from where the activity of H7N9 cases in humans has been originating. 

164 cases and the total number of deaths is a touch under 50.