Showing posts with label epidemic curve. Show all posts

Saturday, 22 August 2015

Watch that last step, it's a doozy..

For each of the past five weeks, Guinea has continued to throw up 1-5 Ebola virus disease (EVD) cases. But transmission chains are known and so this will hopefully stop very soon. Tracking down contacts that have been lost to follow-up and unknown spread in the community remain big variables in this equation. 

Sierra Leone has reported 1-3 EVD cases over that period - but importantly, the last of those cases was reported by the World Health Organization (WHO) on the 10th of August - 12 days ago. We've seen one full case-free reporting week so far, and the next is looking good for Sierra Leone as well. 

The latest confirmed EVD case data plotted below - which stretches from February to last Friday - we can really see how the death of an epidemic has occurred in steps. For Liberia, there was a very dramatic and precipitous decline, but for Sierra Leone and Guinea, it has been a slower process. 

It looks like we will see an end to the EVD epidemic as we saw it begin, with Guinea harbouring cases. 

And then we wait, watch and remain wary as the 21-day individual incubation periods elapse, then the 42-day national incubation periods lapse, indicating no known ongoing transmission, and finally the many months of vigilance pass. I'm not sure we're really that confident about the upper limit of this final step yet. 

I can't imagine the period of vigilance will pass entirely without incident - Liberia has already taught us a hard lesson about occult transmission - but we've all been wrong about Ebola virus before and it would be great to be wrong about this. Here's hoping those final steps are a smooth descent to zero.


Confirmed cases added by each WHO Situation Summary of Situation Report.
Modified from my Ebola virus disease graphs and tallies page.
Click on image to enlarge

Saturday, 13 June 2015

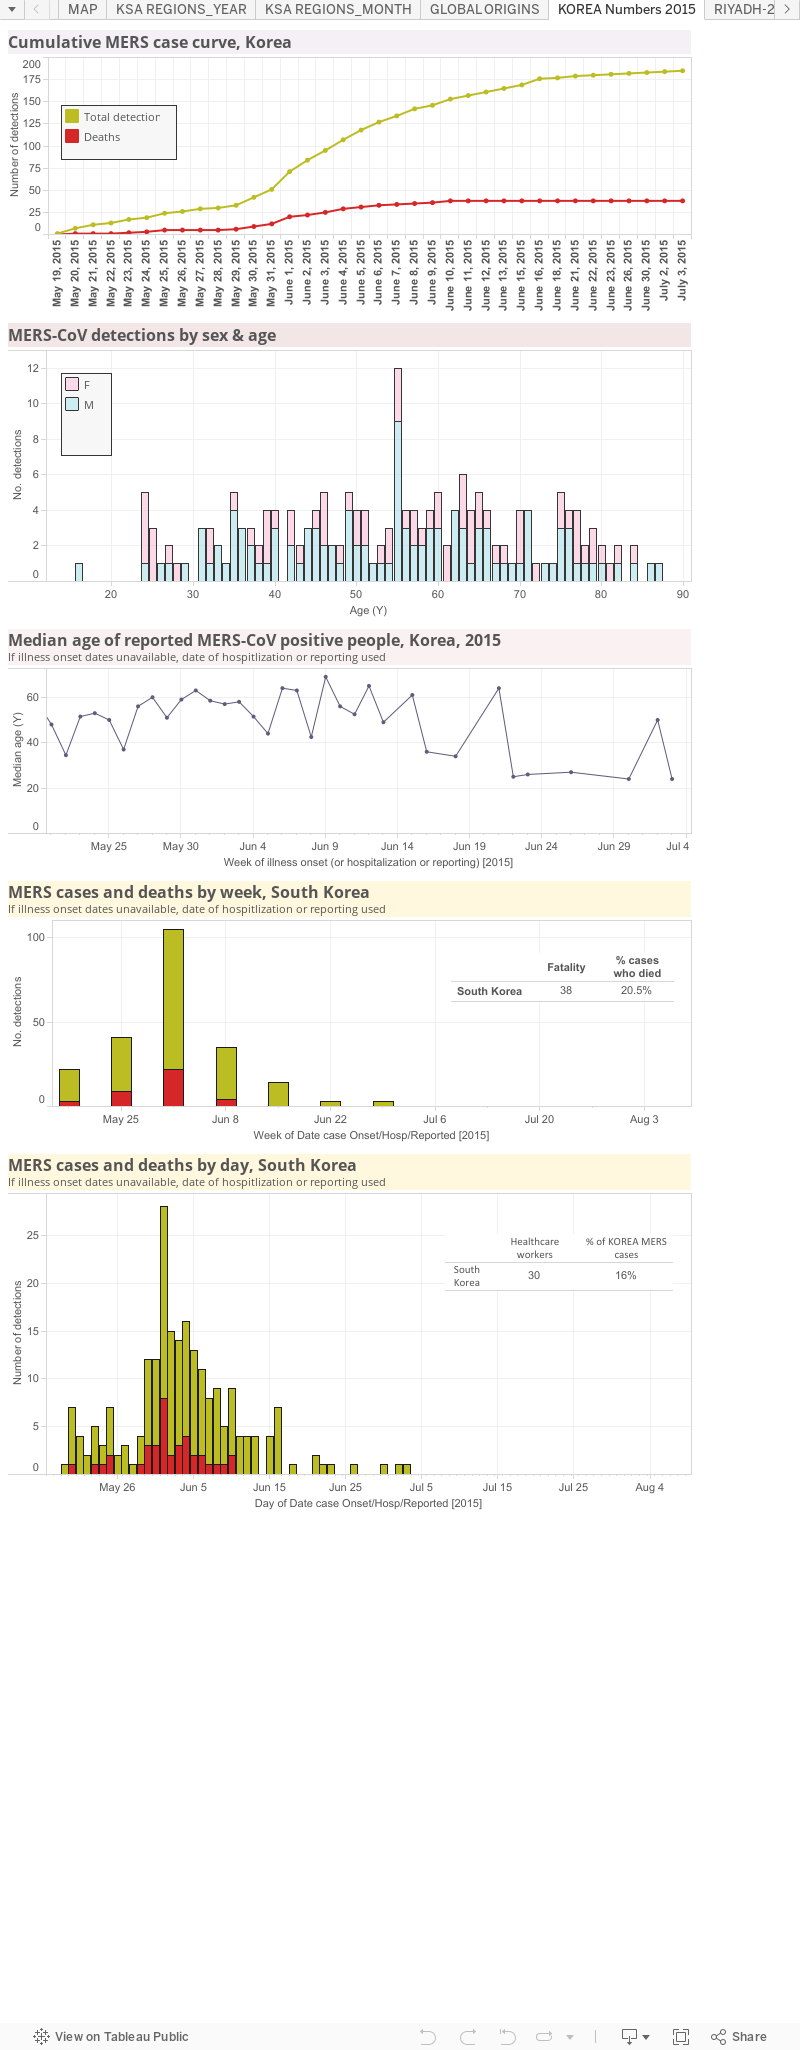
Middle East respiratory syndrome (MERS) coronavirus: Outbreak maps and graphs, South Korea

This static data visualization was created using data from FluTrackers, the World Health Organization and the Korean Broadcasting System (KBS).

Wherever possible, the dates are those for a case's onset of illness, but if that is unavailable then the date for hospitalization or if that is unclear, the date that case was reported.

Because the WHO obviously have more detailed information, I recommend you keep an eye on their site, so long as it is being maintained, for more accurate epidemic curves.


References...

2. The Korean Broadcasting System's News websites
http://dj.kbs.co.kr/resources/2015-06-08/ &
http://dj.kbs.co.kr/resources/2015-06-04/
3.  World Health Organization pages
Main landing page on MERS and MERS-CoV (includes link to WHO line list under General Information)
http://www.who.int/emergencies/mers-cov/en/
Disease Outbreak News pages
http://www.who.int/csr/don/don_updates/en/
 
News on the current situation
http://www.wpro.who.int/outbreaks_emergencies/wpro_coronavirus/en/
Summary of Korean statistics-rapidly updated

http://www.wpro.who.int/outbreaks_emergencies/summary.of.MERS.stats/en/

Wednesday, 28 January 2015

Are fewer Ebola virus disease cases being confirmed than previously?

A very quick graph plotting the proportion (percentage, %) of laboratory-confirmed Ebola virus disease (EVD) cases reported by the WHO over time. That is, the of samples taken from clinically suspected EVD cases that are RT-PCR positive for Ebola virus in a given report, divided by the total number of suspected + probable + confirmed cases in that report.

Taken from my static
EVD tallies and graphs
page here
. Updated
28JAN2015 AEST.
Click on graph to enlarge. 
Looking at the graph below, it seems like a lower proportion of total cases are being confirmed now compared to before the total case load began decreasing (especially from December onwards-see adjacent graphic). 

Presumably this is due to the larger number of other infectious diseases in the region that cause signs and symptoms, especially early signs and symptoms, that cannot be easily clinically differentiated from EVD; more suspect cases that don't test positive for EVD than before.

When considered in the context of the now smaller number of EVD cases overall, the non-EVD infection's background "noise" has become louder.

But the bottom line is that EVD cases are steadily declining thanks to the many efforts of many people and the changes to habits, traditions and practices that increased risky contact.

The proportion (%) of EVD detection that are laboratory confirmed at each World Health Organization Situation Report or Situation Summary. Anomalous values have been removed. Click on graph to enlarge.

Friday, 26 September 2014

MERS-CoV data request: A response from the Ministry of Health

Four days after I posted a blog requesting missing data on retrospective Middle East respiratory syndrome coronavirus (MERS-CoV) detections and deaths, I received a response. 

Dr Anees Sindi, Deputy Commander of the Command and Control Centrer, Ministry of Health, Saudi Arabia replied. With his permission, I have reproduced his reply below.
______________

Sent: Tuesday, 23 September 2014 6:36 PM
To: Ian M Mackay
Subject: Re: your request for missing data on retrospective MERS-CoV detections

Dear Dr. Mackay,

I’m writing in response to your blog posting entitled “A request for missing data on retrospective MERS-CoV detections.”

Thank you for acknowledging the steps that the Ministry of Health’s Command & Control Center has taken to ensure members of the public -- including researchers around the world -- have access to real-time information about MERS-CoV cases in the Kingdom of Saudi Arabia.

These daily postings are a small step on our journey toward full transparency. We want scientists to have access to the data they need to produce meaningful publications that advance our understanding of this disease for the benefit of mankind.

With that in mind, I am happy to inform you that the Ministry of Health is in the process of preparing additional data for public release. I will follow up with you once we have a confirmed release date.

Collaboration with the international research community is a key pillar of our work. In addition to sponsoring more than 30 research projects focused on MERS-CoV, the Ministry of Health has opened its doors to academics and experts from the World Health Organization and U.S. Centers for Disease Control & Prevention. MOH shares more data with the WHO than is required under the International Health Regulations, and we stand ready to support other scientists with an interest in better understanding coronavirus.

Thank you again for your interest in our work.


Best Regards,

Dr. Anees A. Sindi
Deputy Commander
Command and Control Center, Ministry of Health
Saudi Arabia


______________

This is fantastic news and I am very excited to hear that we may soon be able to complete the data picture for MERS-CoV. 

I am most grateful to Dr Sindi, the Minister and the Ministry for taking my request seriously and for replying to it so quickly.


With these data in hand, many of us will be able to build better epidemiological picture of the timing, spread and impact of MERS-CoV over the past 2 years as well as more specifically quantify MERS among fatal cases. 

These data do not answer all the questions we have of course, but they definitely answer some, and for that I'm thankful.

This social media thing does seem to have some impact.

Sunday, 1 June 2014

Snapdate MERS-CoV chart update

Just a quick look at some updated Middle East respiratory syndrome coronavirus (MERS-CoV) detection figures. 

For 2-days this past week we had zero cases reported, but we still had a number of deaths. On the 27-May alone there were 5 deaths across 3 regions.


Weeklies chart.
Number of lab-confirmed cases on the left upright (y-axis), the cumulative weekly
average can be read from the right y-axis and the bottom (x-axis) lists data by week, 
usually week when signs & symptoms onset otherwise by hospitalisation date or
reporting 
if nothing else is available.
Click on image to enlarge.

The dailies chart shows that detections have reached zero. Been a while since that happened-earl April was the last time. This will possibly change as cases from coming days fall out with onset dates in this week. 
Or perhaps there won't be any cases in the coming week. We can only hope.

Dailies chart.
Number of lab-confirmed detecteions on the left y-axis and the x-axis lists data by day,
usually day of when signs & symptoms onset otherwise by hospitalisation date or reporting
if nothing else is available.

Click on image to enlarge.
I haven't added a healthcare worker (HCW) to my line list for the past 63-detections. That's the longest period without an HCW in the history of MERS! Is that true or are those data now withheld form the Kingdom of Saudi Arabia's numbers? Don't know. But here's what it looks like as yet another healthcare-related outbreak subsides.

Cumulative number of lab-confirmed detections among HCWs on the left y-axis while the right y-axis shows the proportion of MERS-CoV detection who were HCWs that week. The x-axis lists data by week, usually day of when signs & symptoms onset otherwise by hospitalisation date or reporting if nothing else is available.
Click on image to enlarge.

Friday, 21 February 2014

H7N9 snapdate: epidemic curve as Wave 2 looks to be ending...

Click on image to enlarge.
This image is another way of showing that the current wave of human cases of avian influenza A(H7N9) virus is ending and that we are solidly within a period of "tailing" (cases only ticking over at low levels in the lead-in or lead-out of the main peak).

BUT: These data are based on figures that are publicly available. As we learned overnight, those numbers can come in fits and starts, if at all. The addition of a large number of deaths without any identifying information linking to the case onset, supports what some have been suspecting for a while; we don't have a full picture of what's happening with H7N9. 

There are now up to 48 more deaths due to H7N9 infections, depending on where your base count is taken from (verified updates or or the media) than we knew about 12-hours ago.

More on that topic later today.