Wednesday, 7 September 2016

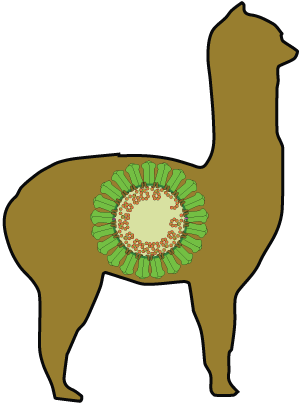
MERS-CoV: alpacapalooza...

In the search for the animals that may be another reservoir for, or just support infection by, Middle East respiratory syndrome coronavirus (MERS-CoV), a few studies have looked at furry little alpacas (Vicugna pacos). 

We already know from Eckerle and colleagues' work that cells derived from alpacas have the required receptor molecule used by MERS-COV (
DPP4) and that they can support replication of MERS-CoV in the lab,[1] But are cells in flasks different from furry animals in the wild?

Three articles came out in the June 2016 issue of Emerging Infectious Diseases looking at alpacas and MERS-CoV. There's no way to tell who submitted when in this journal (ongoing grr).

Colorado State University team sought an easier - but still relevant - animal model than camels to work with.[2] They infected 3 (called A1, A2 and A3) alpacas with 107 plaque forming units (PFU; a cell-specific measure of the amount of infectious virus in a diluted sample) of the HCoV-EMC/2012 variant of MERS-CoV via 3ml of diluted virus per nostril. 3 days later, they housed 3 more uninfected alpacas (A4-A6) with the infected ones.  

After 70 days, A1-A6 were infected again ("challenged"), in the same way. Three other alpacas were infected the same way but euthanized 5 days after infection and their tissues collected for analysis. Nasal swabs were collected before infection and then daily from all living animals for 5 days post-infection and on day 10. A4-A6 were also swabbed 3 times per week to day 19. This could all have been a bit more clearly demonstrated using a timeline by the way.

None of the infected animals had a fever or observable nasal discharge and their appetites and activity remained constant; they didn't seem to be affected by infection with MERS-CoV. Infectious MERS-CoV was shed by A1-A3 to day 5 and transmission occurred to the A4-A6 arrivals:

  • A4 was found to shed virus for 1 day, 
  • A5 shed no virus and 
  • A6 shed across 8 days. 
Lots of variation even in a controlled environment like this.

When furries A1-A6 were challenged with a fresh infection, A1-A3 developed antibodies which protected them from infection (because no virus was shed). A4-A6 shed a little infectious virus for at most 2 days. A4-A6 also developed neutralizing antibodies but took longer than A1-A3 to do so. 

A wild transmission occurred from inoculated A1-A3 to naive A4-A6. This was a lower dose than the original inoculum, and seemed to elicit a milder antibody response in animals A4-A6 as well. 

Virus was found in the nose, larynx and trachea of A7-A9 but not the lungs.


The Australian/Singapore team sought an animal model of MERS with a better temperament and more manageable size than the camel.[3] 

Under biosafety level 3 conditions, they used a camel MERS-CoV variant (Al-Hasa_KFU-HKU13/2013) and exposed each alpaca to 106 50% tissue culture infectious doses (TCID50; another cell-specific measure of infectious virus quantity), monitored for 21 days then challenged as described above.

Blood as well as nasal, oral, rectal and urogenital swabs were collected over time and tested by sensitive RT-PCR, culture and for the presence of neutralizing antibodies.


The furries once again did not develop a fever (animal No.2 had a raised temperature though) or a respiratory illness.
Not a great model of disease, perhaps good for transmission?

Infectious virus was isolated from oral upper and deep nasal swabs but not from urogenital or rectal swabs. RNA detection by RT-PCR followed this same pattern. After challenge and in the presence of antibodies which had appeared from day 10-12, viral RNA could not be detected anywhere in any animal.

Neutralizing antibody did not appear until 21 days in animal No. 1, 10 days in No. 2 and still hadn't appeared at day 35 in No. 3. But, it was apparently unnecessary for protection from reinfection in this study of alpacas.


These 2 studies used 106-107 cell-specific quantities of MERS-CoV to infect the alpacas, but, when sought, less was produced by the newly infected animals - except in one of the Australian/Singapore animals where the peak of 106 TCID50 detected equalled the input dose. This finding suggests the laboratory inoculum may not be relatable to real-world amounts of virus produced by an infected animal source. It may however, just be how much is needed to get a model system infected.

The authors all agreed that alpacas could be a good model for MERS-CoV in camels and that animal infections supported the finding of the initial alpaca cell culture work. But that culture link is not quite so straightforward.

Deliberately infected goats, sheep and horses (using the HCoV-EMC/2012 variant of MERS-CoV) - also animals whose cells had supported MERS-CoV in the laboratory - showed little or no sign of viral replication and the animals mostly remained healthy (some nasal discharge was seen from 2 of 4 horses).[5]

Despite some signs of neutralizing antibody developing in goats and a sheep, the same Colorado team were not convinced that any of these animals would be likely hosts for MERS-CoV in the wild.


Cells in a flask are not always the most realistic model for animal transmission I guess.


The final alpaca article was from a Qatar/Netherlands team who tested alpacas in a region of Qatar where MERS-CoV is found to be enzootic among camels (spreading naturally among the animals).[4] 

Hobby alpaca and camel herds were the subjects of this study. They had been kept about 200m apart in the same farm and cared for by the same animal workers.

Blood samples were tested from 15 alpacas and 10 dromedary camels; nasal swabs were also collected from the 10 camels. Nasal, rectal and oral samples were only collected from a subset of the alpacas for antibody testing and sensitive RT-PCR.

MERS-CoV neutralizing antibody was present in 15 of 15 alpacas and 9 of the 10 camels according to a 90% plaque-reduction neutralization test. This indicated past natural infections had occurred.

Antibodies were also detected that suggested past infection by dromedary betacoronaviruses and camelid alphacoronaviruses but this was not unusual nor unexpected.

No swabs were positive by RT-PCR indicating that no animals were infected at the time of sampling. The authors did not know when, how or how often MERS-CoV may have naturally infected the alpacas.


So we can add alpacas to camels on the short list of animals that can host MERS-CoV infection.

References...
  1. Replicative Capacity of MERS Coronavirus in Livestock Cell Lines
    https://wwwnc.cdc.gov/eid/article/20/2/pdfs/13-1182.pdf
  2. Infection, Replication, and Transmission of Middle East Respiratory Syndrome Coronavirus in Alpacas
    http://wwwnc.cdc.gov/eid/article/22/6/pdfs/16-0192.pdf
  3. Experimental Infection and Response to Rechallenge of Alpacas with Middle East Respiratory Syndrome Coronavirus
    http://wwwnc.cdc.gov/eid/article/22/6/pdfs/16-0007.pdf
  4. MERS-CoV Infection of Alpaca in a Region Where MERS-CoV is Endemic
    http://wwwnc.cdc.gov/eid/article/22/6/pdfs/15-2113.pdf
  5. Inoculation of Goats, Sheep, and Horses with MERS-CoV Does Not Result in Productive Viral Shedding
    http://www.mdpi.com/1999-4915/8/8/230

Sunday, 4 September 2016

There (might be) something in the air tonight... [UPDATE]

UPDATE No.1 06SEPT2016
One of the early pieces of science-based news to come out of the May-2015 Middle East respiratory syndrome coronavirus (MERS-CoV) outbreak in South Korea was a June-2015 piece asking whether air conditioning may have played one (of many?) key role in facilitating the spread of virus from infectious patients, within healthcare facilities.[1]

In a publication that came out in April 2016 (yes, the literature did not see much detail on the South Korean outbreak for quite some time), authors described a study to collect and test air and swabs from surfaces in and outside patient's rooms, and their restrooms, in 2 hospitals that housed 3 male cases of MERS pneumonia.[2]

Whenever RT-PCR is used for this sort of work, it brings with it the question of whether infectious virus-containing droplets were captured, or only bits of non-infectious RNA viral genome was detected. This group, like those in the last post (who did not collect air samples), attempted to grow infectious virus. They could confirm that it was infectious virus by observing cell changes in infected laboratory cultures which were also RT-PCR positive. Also the same approach as that described by the South Korean study reviewed in the last post.[3] Additionally, the infected cell cultures also reacted to an anti-Spike protein antibody in a fluorescent test and they even saw some actual virus from swab cultures (not captured air samples?) using electron microscopy.

Some interesting findings from the use of these test on air and swabs samples included:

  • All air samples from both hospitals were RT-PCR positive and these included the detection of MERS-CoV of RNA in room, restroom and common corridor air. Infectious virus was grown in cells from from 4 of 7 (57%) samples.
  • 42 of 68 (62%) surface swab samples tested positive for MERS-CoV RNA by RT-PCR and included elevator button and rails, doorknobs and handrails inside and outside a patient's room, telephone button, toilet seat, call button, patient pillow, nasal prong, toilet seat, TV, keyboard, stethoscope and air exhaust dampers. Infectious MERS-CoV was isolated from 15 swabs of some of these items including an elevator button, nasal prong, patient pillow, TV, bed handrail, keyboard, stethoscope, toilet seat and an air exhaust damper

This study really addresses three big issues. 

Firstly MERS-CoV from very ill patients late in their disease course, thoroughly contaminates a hospital room and its surrounds - not just with detectable genetic material, but with infectious, viable MERS-CoV virus. 

Secondly, surface contamination was detected from swabs collected 3-7 hours after daily room cleaning suggesting either that cleaning was insufficient or that new virus was quickly laid down on cleaned surfaces (with no lasting anti-viral effect from the cleaning solution). 

Thirdly, the capture of infectious virus from the air implies that the virus maybe present in droplets or droplet nuclei with implications for the level of personal protective equipment required for healthcare workers and visitors to an infected person bedside. It also pertains to the distance away from a case that is considered "safe" for an uninfected person to be. Six feet may not be nearly enough distance, at least if that is a prolonged period in a room.

This provides some more data to explain how MERS-CoV may be associated with hospital outbreaks. Why it has been allowed to get away with this is a matter for infection prevention and control specialists in each and every healthcare facility to address.

UPDATE.

After this was published, Van Kerkhove and colleagues wrote a letter to the editor to make some points about the study noting:

  • an absence of negative control sampling from areas where MERS-CoV patients were not housed.
    Absolutely. I'd even suggest a few different sites in very distant hospital areas from where MERS patients were housed, given the possible human-spread of virus around a facility during and the possibility of silent or subclinical infection in patients admitted to hospitals for other reasons during times of outbreak. This will explore whether false positive laboratory results are occurring.
  • other studies have reported surface contamination that did not yield viable virus. Van Kerkhove note that these negative findings need to be published to balance the literature. Always.
    However, it's well known that virus culture is insensitive compared to RT-PCR methods so it
    may fail to detect infectious virus which may be enough to infect a human . It may also be that infectious virus capable of infecting another person who comes into contact with it is not always present in the air or on surfaces. It may be that the surfaces often simply have non-infectious "bits" of virus detected by RT-PCR -these cannot cause a new infection. But in this study infectious virus was able to be isolated from air and surfaces...unless Van Kerkhove and colleagues are implying contamination of the cultures in some way.
  • the need to replicate these findings in other studies.
    Always.
    But as is often the case, let's not wait on those findings to recognise that infectious droplets and contaminated surfaces now have some more data to support them and that they fit nicely into a picture of hospital transmission. Precautionary principle.
A second letter was also written by Myoung-don Oh,[7] noting:


  • few infected cells in the cultures / slow growth.
    This isn't too surprising, it may just reflect that there was a low amount of virus in the air, added to the cell cultures compared to that used from the control virus (cell adapted?) stock.
    This may mean that the risk from airborne transmission in these rooms is low. However, since we don't know what amount of MERS-CoV is required to start a new human infection, this is a moot point.
  • the sequences of the room samples were too different from each other.
    This is a bit surprising since within an outbreak, MERS-CoV doesn't usually vary much at all. I'll have a look at how much South Korea's MERS-CoV Spike gene sequences varied and come back to this point.

Both letters were replied to.[8]

References...


  1. Did poor ventilation lead to MERS 'superspread' in Korea?
    http://www.sciencemag.org/news/2015/06/did-poor-ventilation-lead-mers-superspread-korea
  2. Extensive Viable Middle East Respiratory Syndrome (MERS) Coronavirus Contamination in Air and Surrounding Environment in MERS Isolation Wards
    http://cid.oxfordjournals.org/content/early/2016/06/08/cid.ciw239.abstract
  3. Korea contamination: Middle East respiratory syndrome coronavirus in the room..
    http://virologydownunder.blogspot.com.au/2016/09/korea-contamination-middle-east.html
  4. Interpreting Results From Environmental Contamination Studies of Middle East Respiratory Syndrome Coronavirus
    http://cid.oxfordjournals.org/content/early/2016/08/09/cid.ciw478.full.pdf
  5. STABILITY OF MIDDLE EAST RESPIRATORY SYNDROME CORONAVIRUS (MERS-COV) UNDER DIFFERENT ENVIRONMENTAL CONDITIONS
    http://www.eurosurveillance.org/ViewArticle.aspx?ArticleId=20590
  6. Transmissibility of Middle East Respiratory Syndrome by the Airborne Route
    http://cid.oxfordjournals.org/content/early/2016/08/09/cid.ciw479.full.pdf
  7. Interpreting Results From Environmental Contamination Studies of Middle East Respiratory Syndrome Coronavirus
    http://cid.oxfordjournals.org/content/early/2016/08/09/cid.ciw478.full.pdf
  8. Reply to Kerkhove et al and Oh
    http://cid.oxfordjournals.org/content/early/2016/08/09/cid.ciw480.extract
Update...
  1. Added in detail on letter by Van Kerkhove and colleagues [4], and rebuttal authors [5]

Friday, 2 September 2016

Korea contamination: Middle East respiratory syndrome coronavirus in the room..

This post has been moved to the new Virology Down Under platform on WordPress.

You can get to this specific post by clicking on the link below...


Please adjust your bookmarks.

Apologies for any inconvenience.

Monday, 29 August 2016

A pile of TWADALs...

This post has been moved to the new Virology Down Under platform on Wordpress.

You can get to this specific post by clicking on the link below...
 
http://virologydownunder.com/a-pile-of-twadals/

Please adjust your bookmarks.

Apologies for any inconvenience.

Sunday, 28 August 2016

Colombia Zika virus report, Epidemiological Week No. 33...

UPDATE No.1: 29AUG2016
The latest epidemiological report from Colombia, which includes data on Zika virus disease (ZVD; 14AUG2016-20AUG2016), has been produced by the Colombian National Institute for Health team.[1]
NOTE: While these data were reported the past epidemiological week, they may not be from that week. See earlier post about possible reporting lag.

Graph No.1. The cumulative curve of confirmed ZVD cases
(green circles, left-hand axis) and the change in confirmed ZVD case
numbers when compared to the preceding week's total
(green bars, right-hand axis). Data from [1].
Click on graph to enlarge.
Graph No. 1 shows that 0 new laboratory confirmed cases of ZVD were reported this week; the 6th week of this. The total sits at 8,826 or 9% of all clinically suspected Zika virus (ZIKV) detections.

Graph No.2. The cumulative curve of suspected ZVD cases
(pink circles, left-hand axis) and the change in suspected ZVD case
numbers when compared to the preceding week's total
(red bars, right-hand axis). Data from [1].
Click on graph to enlarge.
Graph No. 2 shows the change in suspected cases. These are not laboratory confirmed. The suspected ZVD cases continue to rise but have been slowing for weeks, adding 270 this week to total 93,551.

Graph No.3. The cumulative curve of clinically suspect (lilac triangles, left-hand axis) and confirmed ZIKV infections (lilac circles, left-hand axis) and the change in
confirmed ZIKV infection numbers when compared to the preceding week's total
(purple bars, right-hand axis). Now added the reported number of microcephaly cases
confirmed as ZIKV infected (yellow bars, right-hand axis). Data from [1].
Click on graph to enlarge.
Graph No. 3 shows that to epidemiological week (EW) No. 33, 11,752 suspected (+30 compared to last week) and 6,054 confirmed ZIKV infections (-2) have been identified in pregnant women.

As of this report, 34 (+5 from last EW) live births have been diagnosed with congenital ZIKV syndrome (CZVS; microcephaly/central nervous system disorder), confirmed as being ZIKV positive. That represents 0.53% of all confirmed ZIKV positive mothers-the 4th consecutive EW in which this proportion has risen.

Some back of napkin calculations looking at these numbers suggest that there are 5-6 deliveries for every 1,000 ZIKV-positive pregnant women that result in a ZIKV infected baby with microcephaly. This assumes each neonate has been tested for ZIKV as [6] suggests. This figure has no clear understanding of the number of aborted or miscarried foetuses that are also occurring from ZIKV-positive pregnant women. Abortions and miscarriages will need a local baseline to understand the scope of this component of the impact of ZIKV infection.

209 other microcephaly diagnoses (down from 254 last week) are now under investigation - this value has also been rising very quickly and suggests suspicious CZVS cases in Colombia are accruing faster than the pace of complete investigation can keep up with. 

It now seems very likely that we can expect those bars to keep rising steeply in the coming weeks. The line is well and truly crossed.

Graph No. 4 below focuses on just the ZIKV-positive cases and those that remain under investigation, highlighting how the investigatory total has changed each week and been trending upwards since Epidemiological Week No. 14 and rising by +5 for 2 weeks in a row.

Graph No.4. The change in confirmed ZIKV infection numbers
when detected in association with a microcephaly diagnosis, compared
to the preceding week's total (yellow bars, left-hand axis). Data are from [1].
Click on graph to enlarge.
It has now been 317 days, or 10 months 12 days, since ZIKV was first confirmed in Colombia on 16th October 2015.[2] Colombia is currently carrying the next biggest load of suspected ZVD cases [8] (although more confirmed in Puerto Rico. NB: not all of the "Casos confirmados" are lab confirmed, but I'm told most are).[3] Keep in mind that when talking about microcephaly - we have to think back in time to what insult or infection might have occurred in the first or second trimester (probably-still not definitive). The counts of virus occurring this week will have zero impact on what happened back then. Also keep in mind that Colombia may be reporting things differently from Brazil.[5,7]

Brazil first reported positive (but unconfirmed) laboratory tests for Zika virus disease on 29th April 2015. Brazil then started to report a rise in foetal anomalies (an initial 141), in the form of microcephaly on 30th October 2015. This was 184 days - or about 6 months later.[4]


References...

  1. http://www.ins.gov.co/boletin-epidemiologico/Boletn%20Epidemiolgico/2016%20Boletin%20epidemiologico%20semana%2033.pdf
  2. http://www.who.int/bulletin/online_first/16-171082/en/
  3. http://www.nature.com/news/first-zika-linked-birth-defects-detected-in-colombia-1.19502
  4. http://who.int/bulletin/online_first/16-171082/en/
  5. http://virologydownunder.blogspot.com.au/2016/06/the-elephant-squeaked.html
  6. Zika Virus Disease in Colombia — Preliminary Reporthttp://www.nejm.org/doi/full/10.1056/NEJMoa1604037#t=article
  7. https://www.statnews.com/2016/06/22/zika-abortion-latin-america/
  8. http://www.salud.gov.pr/Estadisticas-Registros-y-Publicaciones/Pages/Informe-Arboviral.aspx
Updates...
  1. Clarified Puerto Rico has more confirmed cases than Colombia but fewer suspected

Friday, 26 August 2016

Get off my lawn you experts!

Two things were suggested by Richard P Grant in his recent piece for the Guardian, as reasons why scientists are losing the battle to communicate science.[1] 

First, scientists keep telling people how to live their lives and second, scientists don't listen to people.

Okay - I agree. Scientists do that. When I started on social media, I mentally added "try not to be a supercilious git" to my list of things to do to be a better human being. That was up there with "make memories for my kids", "always work at my marriage", "don't speak ill of other people", "listen instead of interrupting", "don't be unintentionally racist", "be conscious of innate bias"...the list goes on and keeps growing. 

But I still come across as a supercilious git on occasion. I'm not really sorry about that though. The main reason I do so is because my tribe is that of the scientist (#tribescience ?). A few different science tribes really. I've spent the past 30 years picking up the ways of my tribe - certain phrases, learning to speak in certain ways, using big scientific words, writing with a certain pattern, producing documents that everyone - including me - find boring, seeing patterns and thinking about how things around me can be tested, seeking out the next big idea that will fund my life and home loan and trying to remain agile enough to be prepared to update those views and words when all that I've learned changes in an instant. Imposter syndrome for an academic can drive the need to sound just as supercilious as our peers. It's a lot of baggage to set down if you dip in and out of interpreting science for the public. Facts, not excuses.

As a little experiment, I thought I'd look at how far listening got me when related to the "dangerous ones" [1]- the hardcore anti-vaccination believers. Not my first attempt to understand this group and not my last.

I'd already been in a small chat where someone @MaykeBriggs (not an anti-vaxxer let me stress) had suggested pesticides and "vaccine toxin" exposure should be looked at in relation to Zika virus and microcephaly in Brazil. I'd asked which toxins and we'd had a discussion about phenoxyethanol, used as a preservative in vaccines.[2,3] Interestingly, phenoxyethanol is used widely, because of its fragrant properties, in shampoos, toilet soaps, decorative cosmetics and is found naturally in avocado, endive and tea for example.[3] The things you learn when you read around a topic!

Example of anti-vax brochure.
Next I received a snippet of an abstract by tweet from @LaLaRueFrench75. This went back and forth and just before I went to sleep got a request to comment on a couple of slides of aggregated science and theory by @2ndfor1st. When I woke up I had more tweets awaiting my sultana bran breakfast than on any day during the worst of the Ebola virus event (which got pretty busy for me). 

I'd apparently inadvertently poked an anti-vaccine nest with a stick.

I Storified the whole thing if anyone wants to check it out. 

The biggest thing for me was, I couldn't have told this group how to live their lives even if I'd wanted to! There was no discussion to be engaged in-just me being shown their material from several tweeters at once. Attempts to correct obviously wrong material were ignored, shouted down or artfully sidestepped.

I took a few other things away from this:

  • These are not the vaccine hesitant [5] - people sitting on the fence about whether this or that vaccine may be good or bad for their child. These are fully engaged professional aggregators of content, curates into a story to support whichever thread they are interested in highlighting.
    This group create slick websites, videos, brochures and run a tight campaign to recruit like-minded followers and cast aspersions upon efforts to make our children even more healthy, reduce the burden of chronic disease and prolong life. 
  • A central theme seems to be that there is a conspiracy to force their children to be injured by vaccination, perhaps mostly in relation to mandated vaccination, but vaccines in general.
    But the community today could not show me any example of this injury. It has become a ethereal symbol for the movement, but there is no form nor substance to the claims of death or severe harm by vaccination.
  • If you choose to engage with this group, pick a particular point to address and do not let yourself be dragged away from it by the constant movement of goalposts you'll encounter. If you don't get the answer you're asking for, say that and move on.
  • If you are a scientist planning to engage the public - engage with this group. There is much to learn about communication and about yourself.
    You may be pilloried by your peers (psst - just don't tell them), but you may also gain important experience with extreme believers and very alternate viewpoints.
  • Those against using vaccines - at least based on my example - are mostly focused on the secondary ingredients especially preservatives and adjuvants - aluminium, phenoxyethanol, thiomersal.
    This is pretty low hanging fruit though, because there could be more scientific studies to address some of the questions asked. Science has made a rod for its own back here.
  • This group do have valid concerns. But instead of being able to believe or engage experts, they choose to actively decry them as the puppets of commercial interests and instead seek out words, sentences, clips and snippets to support their views about their concerns.
    Based on a lot of reading this past few days, this material is often "home made", out of context, quote studies that employ excessively high amounts of the chemical in question, or use the chemical repeatedly in a way that does not at all reflect vaccination, or use studies that do not have suitable control groups (h/t @JATetro).
  • The misuse of funds by medical doctors was also a big thing among this group. Apparently this extends to scientists - although that's laughable to me as I'm a science Doctor who has spent many years experiencing how hard it is to scrape together money to get to a conference let alone travel the globe in style.
    I'm aware of the conflict of interest issues pertaining to medical doctors being paid by pharmaceutical interests. The presumption today was clearly that these payments sway these evil doctors towards prescribing that company's products, including more use of vaccines.
    Oversight of vaccines both during early safety and subsequent clinical trials and when later while being monitored for adverse events once they are commercialised, requires experts to come together to review data (costly) - data which themselves are very expensive to collect and collate.
    These payments, must be transparently documented or else consumer trust is rightly shaken. 
  • Those who invent, develop, administer and oversee use of vaccines are seen as different
    "Them and us"
    humans from the true believer anti-vaxxers. This may be for ulterior motives or because of a past bad experience.
    The impression I got was that the  professionals are not thought of as having the same skin in the game - their own families, lives and children - as do "the public".
    Do some of our science and medical doctors need to humanise more, at least in this space?  
  • If you write about scientists who try and engage with the public, maybe think more deeply about the term "science communication". Currently it seems to cover everything that comes out of the mouth/keyboard of a scientist. Its too broad. How about adding some more terms? What about Science Interpretation? Science Engagement? If you paint all science communication as coming from a place of arrogance and control, you paint every scientist, even those who honestly try to do better, as arrogant and controlling.
    That's some poor research right there.
    It's also a tone that is likely to discourage other scientists out of their highly competitive, poorly funded, stressful, depressing, abusive, overcrowded, biased, "cosy little bubble and make an effort to reach people where they are, where they are confused and hurting; where the need"
Of course, if we do seek out people who seem confused, there is no guarantee we'll be able to get a word in edgewise. That does make being a tribal and supercilious git all the more challenging. But it's what we scientists excel out. Right?


References...

Saturday, 20 August 2016

Tests and temps...

From [10]
It's been about 5 weeks since Brazil updated its microcephaly-related-to-Zika-virus reporting index page. 

The last post listed (a couple of others made their way out via other channels) was from epidemiological week (EW) No. 26. 

For comparison, Colombia is about to post data for EW No. 32. [12]

Interestingly, Colombia's National Institute of Health has not seen any new laboratory confirmed Zika virus disease cases during that same period - so perhaps Brazil is not seeing any either?

Temperature graphs (in Celsius) from 
accuweather.com.
Top-Miami Beach, Florida.
Bottom-Rio de Janeiro, Brazil
Meanwhile, more of the US state of Florida is seeing local Zika virus spread.[4,5,6] If we look at the temperature graphs we can see that Miami Beach (around 32'C)  is certainly a lot warmer and holding more steady than Rio (around 24'C) in August 2916. 

High and fluctuating temperatures are important for flavivirus multiplication in mosquitoes but for the mosquitoes themselves, particularly Aedes aegypti, they can live for about the same period (around 3 weeks) when conditions suit, whether at 26'C or 30'C.[12,13]

As I was recently taught by Rebbeca C Christofferson and Anthony Willson, viral loads do better in mosquitoes living at an optimal temperature. But when more Dengue virus for example, is replicating throughout the mosquito, that can have an effect on the length of their lives, even if not having an immediate impact on mortality.[14]

When you stop and think about it there is a lot going on for a mosquito when it takes a big blood meal. 

There could be a huge rapid weight gain, and there can be a 20'C temperature difference between the host's blood and the insect's temperature - that's a big shock at any size! There is also a big osmotic imbalance (difference in osmotic pressure due to the concentration of dissolved solids in the host's blood versus that in the insect's hemolymph [8,9]) and there's a need to get rid of toxic metabolites.[1] 

Have you seen that big drop of excreted fluid attached to some species of mosquito's butt? It appears once feeding has started and is something they excrete (urine and concentrated red blood cells; a process called prediuresis) to help them balance osmolarity, offset weight gain and sometimes to regulate their temperature through evaporation.[2,7] 

Some mosquito species retain the drop ('drop-keeping') making use of evaporative cooling, some emit new drops.[7] As far as I can tell so far, Aedes species don't make use of the drop for cooling. Male mosquitoes don't heat up because they don't feed on blood so they rely on environmental temperatures for heating and cooling.[7]

So much more reading to be done (apologies for errors above - I'm still learning about mozzies) - just not of data from Brazil.

References...
  1. Thermal Stress and Thermoregulation During Feeding in Mosquitoes
  2. https://en.wikipedia.org/wiki/Insect_thermoregulation
  3. http://www.vanderbilt.edu/hillyerlab/Research__Circulation.html
  4. http://journals.plos.org/plosntds/article?id=10.1371/journal.pntd.0002190
  5. http://www.ncbi.nlm.nih.gov/pmc/articles/PMC4961054/
  6. http://www.ncbi.nlm.nih.gov/pubmed/18021028
  7. http://www.cell.com/current-biology/pdf/S0960-9822(11)01311-X.pdf
  8. https://en.wikipedia.org/wiki/Hemolymph
  9. https://projects.ncsu.edu/cals/course/ent425/tutorial/circulatory.html
  10. http://portalsaude.saude.gov.br/index.php/o-ministerio/principal/leia-mais-o-ministerio/197-secretaria-svs/20799-microcefalia
  11. http://www.ins.gov.co/boletin-epidemiologico/Boletn%20Epidemiolgico/Forms/public.aspx
  12. http://www.ncbi.nlm.nih.gov/pmc/articles/PMC4961054/pdf/ehi-10-2016-119.pdf
  13. http://journals.plos.org/plosntds/article/asset?id=10.1371%2Fjournal.pntd.0002190.PDF
  14. http://www.ncbi.nlm.nih.gov/pmc/articles/PMC4961054/pdf/ehi-10-2016-119.pdf

Sunday, 14 August 2016

Wednesday, 3 August 2016

Spillover: tales of the zoonosis...

I highly recommend this document on tonight in the United States and hopefully coming to your country soon thereafter.


I had a small advisory role (see proof below!) on this over the course of about 19 months and I can assure you that it is a beautifully put together, visually delicious and educational summary of some of our planet's most recent animal>>human viral outbreak events.


Spillover credits, Page 1.