 |
| Click on image to enlarge. |
Showing posts with label cumulative curve. Show all posts
Showing posts with label cumulative curve. Show all posts
Tuesday, 22 March 2016
SNAPDATE: MERS-CoV around the world...
A quick snap update to show how the Middle East respiratory syndrome coronavirus (MERS-CoV has been travelling around the world in the pat 4 years, using a cumulative curve.

Monday, 14 March 2016
Middle East respiratory syndrome coronavirus kicks off...
 |
| Click on it. It gets bigger! |
Since 2012, 1,702 MERS-CoV detections have been reported in humans from 26 countries around the world.
 |
| Click to expand. Graph captured from [3] |
Each year we news and number watchers, wonder aloud about the course that MERS-CoV might plot. We don't predict it though - that would be dumb. No-one can know where things may go because that's all based on human behaviours, oversights and mistakes. And who knows how, how many, how often, why or when those will occur?
MERS-CoV is very much a human problem - it's a particularly opportunistic virus which causes it's biggest impact when we create the conditions for it to spread among vulnerable people in health care settings. Whether or not that whole process will play out again in 2016 is anyone's guess. As I noted in my last post, it has already happened to some degree in Buraidah in the Al Quassim province of KSA. The KSA is - if you are new to MERS-CoV - the country in which 80.4% of infection have been acquired. Word oen the Tweet is that the outbreak is under control now.
I've updated my graphs, tallies and charts with the latest numbers now, so feel free to click on the MERS-CoV tab above to see where we're at.@HelenBranswell Because I am closely following the situation as general director of IPC. No evidence of transmission for several days.— هايل العبدلي (@habdely) March 13, 2016
And don't forget - an outbreak of an infectious disease in one country has the potential to be an outbreak in any country. Just add human behaviour.
References...
Wednesday, 28 January 2015
Are fewer Ebola virus disease cases being confirmed than previously?
A very quick graph plotting the proportion (percentage, %) of laboratory-confirmed Ebola virus disease (EVD) cases reported by the WHO over time. That is, the of samples taken from clinically suspected EVD cases that are RT-PCR positive for Ebola virus in a given report, divided by the total number of suspected + probable + confirmed cases in that report.
Looking at the graph below, it seems like a lower proportion of total cases are being confirmed now compared to before the total case load began decreasing (especially from December onwards-see adjacent graphic).
Presumably this is due to the larger number of other infectious diseases in the region that cause signs and symptoms, especially early signs and symptoms, that cannot be easily clinically differentiated from EVD; more suspect cases that don't test positive for EVD than before.
When considered in the context of the now smaller number of EVD cases overall, the non-EVD infection's background "noise" has become louder.
But the bottom line is that EVD cases are steadily declining thanks to the many efforts of many people and the changes to habits, traditions and practices that increased risky contact.
 |
| Taken from my static EVD tallies and graphs page here. Updated 28JAN2015 AEST.Click on graph to enlarge. |
Presumably this is due to the larger number of other infectious diseases in the region that cause signs and symptoms, especially early signs and symptoms, that cannot be easily clinically differentiated from EVD; more suspect cases that don't test positive for EVD than before.
When considered in the context of the now smaller number of EVD cases overall, the non-EVD infection's background "noise" has become louder.
But the bottom line is that EVD cases are steadily declining thanks to the many efforts of many people and the changes to habits, traditions and practices that increased risky contact.
 |
| The proportion (%) of EVD detection that are laboratory confirmed at each World Health Organization Situation Report or Situation Summary. Anomalous values have been removed. Click on graph to enlarge. |
Thursday, 18 December 2014
Ebola double vision is clearing...
A quick follow up from my post in October entitled "Ebola double vision".
I've adjusted that graph and it adds another view of how the Ebola virus disease (EVD) epidemic is, in terms of overall case numbers, showing consistent signs of slowing.
The time it takes for the case total to double (the doubling time) has stretched out from doubling every month or so, to taking about a month and a half to double.
But far from breathing a sigh of relief, the numbers in Guinea, which have never appeared consistently under control, and the still very high numbers in Sierra Leone, highlight that the epidemic is not yet leashed and the need remains for continued vigilance and more of the same hard and risky work being done by those in and around the region. In Liberia, the country that supplied the highest proportion of EVD cases leading up right up until this month, case numbers were down to just 75 in the previous week (reporting week #38). For context, that's still higher than the total of about 15 past outbreaks since 1976. And of course, this entire epidemic started from just 1 case. 100% of infected people need to be isolated and looked after (hydrated given pain relief and antibiotics among other things), 100% of burials need to be safe, and 100% of contacts need to be traced. That represents a huge task ahead of the stalwart healthcare, aid and many other support workers who have been facing Ebola virus every day for months and months.
I've adjusted that graph and it adds another view of how the Ebola virus disease (EVD) epidemic is, in terms of overall case numbers, showing consistent signs of slowing.
The time it takes for the case total to double (the doubling time) has stretched out from doubling every month or so, to taking about a month and a half to double.
But far from breathing a sigh of relief, the numbers in Guinea, which have never appeared consistently under control, and the still very high numbers in Sierra Leone, highlight that the epidemic is not yet leashed and the need remains for continued vigilance and more of the same hard and risky work being done by those in and around the region. In Liberia, the country that supplied the highest proportion of EVD cases leading up right up until this month, case numbers were down to just 75 in the previous week (reporting week #38). For context, that's still higher than the total of about 15 past outbreaks since 1976. And of course, this entire epidemic started from just 1 case. 100% of infected people need to be isolated and looked after (hydrated given pain relief and antibiotics among other things), 100% of burials need to be safe, and 100% of contacts need to be traced. That represents a huge task ahead of the stalwart healthcare, aid and many other support workers who have been facing Ebola virus every day for months and months.
 |
| The time between total case doublings. For 4 doublings in a row it took a month or so, but the most recent doubling took 44-days. Click on image to enlarge. |
Thursday, 18 September 2014
Updating a model of a modern Ebola epidemic...
This morning I awoke to find the fruits of his labour generously presented to the world via Twitter.
I'm constantly impressed by how much info can and is being provided for everyone to share, discuss and constructively mull over. This is just the latest fantastic effort.
Prof Fisman's (@DavidFisman) model has provided a very close estimate when compared to the real figures on which it is, of course, based (Figure 1.). His estimates have not changed with the latest data. He calculates an overall R0 of 1.75, and 'd' (a value that can indicate the level of control; when d is zero, you have uncontrolled exponential growth) is at 0.0078. The d values for different countries in the outbreak, differ.
 |
| Figure 1. Showing that the model (black line) fits extremely well to actual reported case numbers (red bars) to date |
 |
| Figure 2. Extending the model into 2017. Red curve (right y-axis): incidence by 15-day generation. Blue curve (left y-axis): cumulative cases. |
 |
| Figure 3. Ebola virus disease cumulative curve for Nigeria. The proportion of fatal cases is markedly lower than for the more overwhelmed countries. This does not appear to be an artefact as most cases have been laboratory confirmed. |
The addition of that calculation spikes the PFC to >80% at times (see the post by @maiamajumder post on HealthMap), but seems to vary to lower figures depending on country and population for example, in Nigeria (Figure 3). But whatever way you look at it, many people will die from Ebola virus infection, as well as all the other diseases and medical care needs that going with sufficient attention.
References..
- Early Epidemic Dynamics of the West African 2014 Ebola Outbreak: Estimates Derived with a Simple Two-Parameter Model
http://currents.plos.org/outbreaks/article/obk-14-0036-early-epidemic-dynamics-of-the-west-african-2014-ebola-outbreak-estimates-derived-with-a-simple-two-parameter-model/
Thursday, 10 July 2014
Ebola virus disease (EVD) cases, clusters and outbreaks mapped out...
The West African region epidemic (top map), including countries with imported cases and the totals from past Ebola virus disease outbreaks and the few imported monkey cases (the US & Philippines [hence zero human cases]) plotted by total numbers and country (bottom map).
These maps are best viewed alongside my Ebola virus disease numbers page found here.
The WHO create multi-page Situation Reports [2] and brief Situation Summaries.[3] They are currently presented on Wednesday and "additional updated figures" will be posted "as they become available any day of the week" (via eMail to journalists from WHO).
My totals include all countries that have hosted a case in, or sourced from, a West African nation. Countries include Guinea, Liberia, Sierra Leone, Nigeria (now EVD-free), Senegal (now EVD-free), the United States of America, Spain and Mali.
This is a static page but as of 21-Jan-2015 (AEST) I have copied the maps to the bottom of my main EVD EBOV|Makona (west African Zaire ebolavirus variant) outbreak page at: http://virologydownunder.blogspot.com.au/2014/07/ebola-virus-disease-evd-2014-west.html
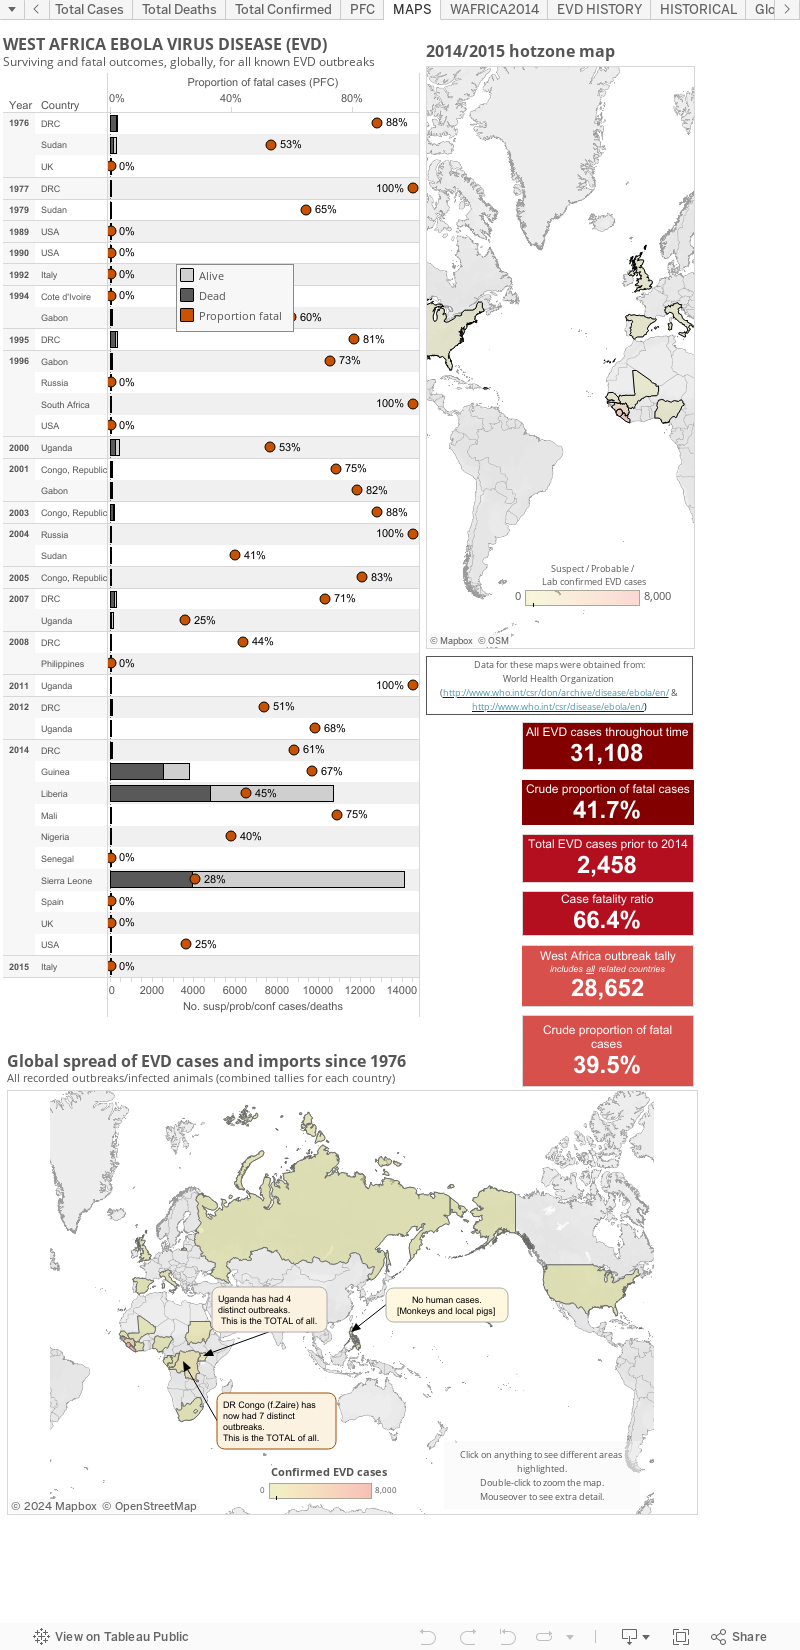 A note about the proportion of fatal cases (PFC):
On these graphs, my PFC calculations for West African countries and the DRC are based on dividing the total number of suspect/probable/confirmed deaths by the number of total suspect/probable/confirmed cases for the same date. This is crude and may be a sizable underestimate of the true PFC.
It may be better to use the deaths at the most recent date divided by the total cases from 9-16-days earlier (this number is not precisely known) to better account for the lag in time between presenting to a treatment facility and dying (for those who do not recover).
Some estimates suggest the true PFC may be closer to 70%-80%. I don't have enough data (or smarts) to be able to calculate the lag for now so please be aware that the PFC above is likely an underestimate.
These maps are best viewed alongside my Ebola virus disease numbers page found here.
The WHO create multi-page Situation Reports [2] and brief Situation Summaries.[3] They are currently presented on Wednesday and "additional updated figures" will be posted "as they become available any day of the week" (via eMail to journalists from WHO).
My totals include all countries that have hosted a case in, or sourced from, a West African nation. Countries include Guinea, Liberia, Sierra Leone, Nigeria (now EVD-free), Senegal (now EVD-free), the United States of America, Spain and Mali.
This is a static page but as of 21-Jan-2015 (AEST) I have copied the maps to the bottom of my main EVD EBOV|Makona (west African Zaire ebolavirus variant) outbreak page at: http://virologydownunder.blogspot.com.au/2014/07/ebola-virus-disease-evd-2014-west.html
On these graphs, my PFC calculations for West African countries and the DRC are based on dividing the total number of suspect/probable/confirmed deaths by the number of total suspect/probable/confirmed cases for the same date. This is crude and may be a sizable underestimate of the true PFC.
It may be better to use the deaths at the most recent date divided by the total cases from 9-16-days earlier (this number is not precisely known) to better account for the lag in time between presenting to a treatment facility and dying (for those who do not recover).
Some estimates suggest the true PFC may be closer to 70%-80%. I don't have enough data (or smarts) to be able to calculate the lag for now so please be aware that the PFC above is likely an underestimate.
- The figure above, as with all on VDU, is made for general interest only. It is also freely available for anyone's use, just cite the page and me (Dr. Ian M Mackay, PhD) please. It may be that I have misinterpreted the language in the reports (sometimes a little tricky to wade through) or miscalculated some totals based on the way data have been presented.
- Sometimes there are very country-specific differences in what gets presented to/via the World WHO DONs/SitReps which make this process less clear than it could be. I recommend you have a read and compare the data from each of the countries for yourself to understand these issues.
- As I've talked about previously,[1] these numbers are all volatile for a variety of reasons, some Ebola-specific, so regard this chart for its trends only.
- I am only able to plot what is publicly available. To date, this does not include granular data with dates of onset, or daily data of any kind. The WHO have these data and you will see them become more available through their Situation Reports found here http://www.who.int/csr/disease/ebola/situation-reports/en/
- Ebola virus disease and lab testing...
http://virologydownunder.blogspot.com.au/2014/04/ebola-virus-disease-and-lab-testing.html - Ebola virus disease outbreak Situation Reports (SitRep)
http://www.who.int/csr/disease/ebola/situation-reports/en/ - Ebola virus disease outbreak Situation Summaries (SitSumm)
http://apps.who.int/gho/data/view.ebola-sitrep.ebola-summary-latest?lang=en
Subscribe to:
Posts (Atom)