Showing posts with label avian influenza. Show all posts

Sunday, 5 March 2017

Avian influenza A(H7N9) virus in humans: lay of the land...

I'm getting a little more of a grip on the H7N9 numbers thanks to the data from the Hong Kong Centre for Health Protection (CHP) [1] - which have been a solid source in 2017.

Keep in mind that these numbers :


  1.  are imperfect because they are reported inconsistently by those who have the data and because they only contain partial detail - death details are impossible to come by.  Please keep in mind that there is no global, running-tally of H7N9 cases presented to the public, by any public health entity. There is a great line list from the citizen-run FluTrackers list, ([2]my usual go-to) but in 2017 they got swamped by these unsatisfactory data.
  2. will only represent those cases that have been lab tested. Any people who have met the criteria for being a "Case" [pick from 3-6] - which in most instance means being sick. In some instances a cases is identified because diligent doctors have followed up those people who had contact with a known case - which is called contact tracing. Sometimes these contacts may virus positive by only mildly ill or have no illness at all.
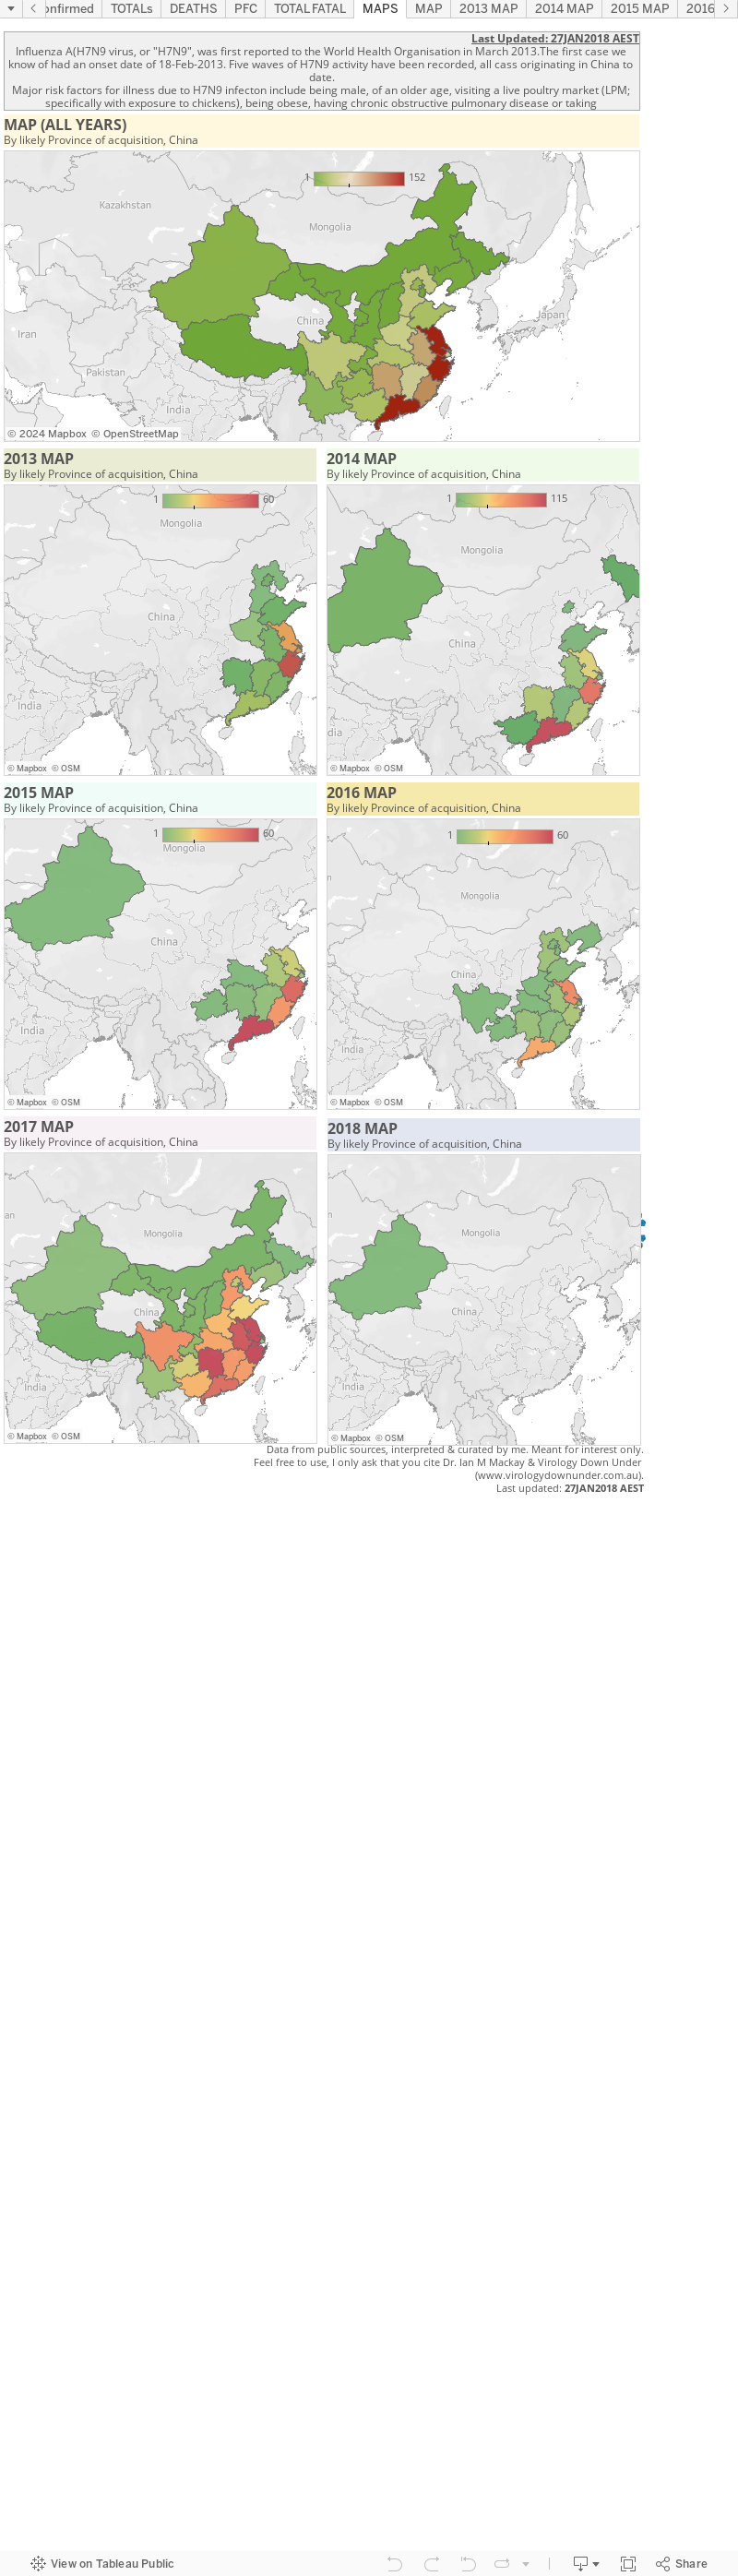
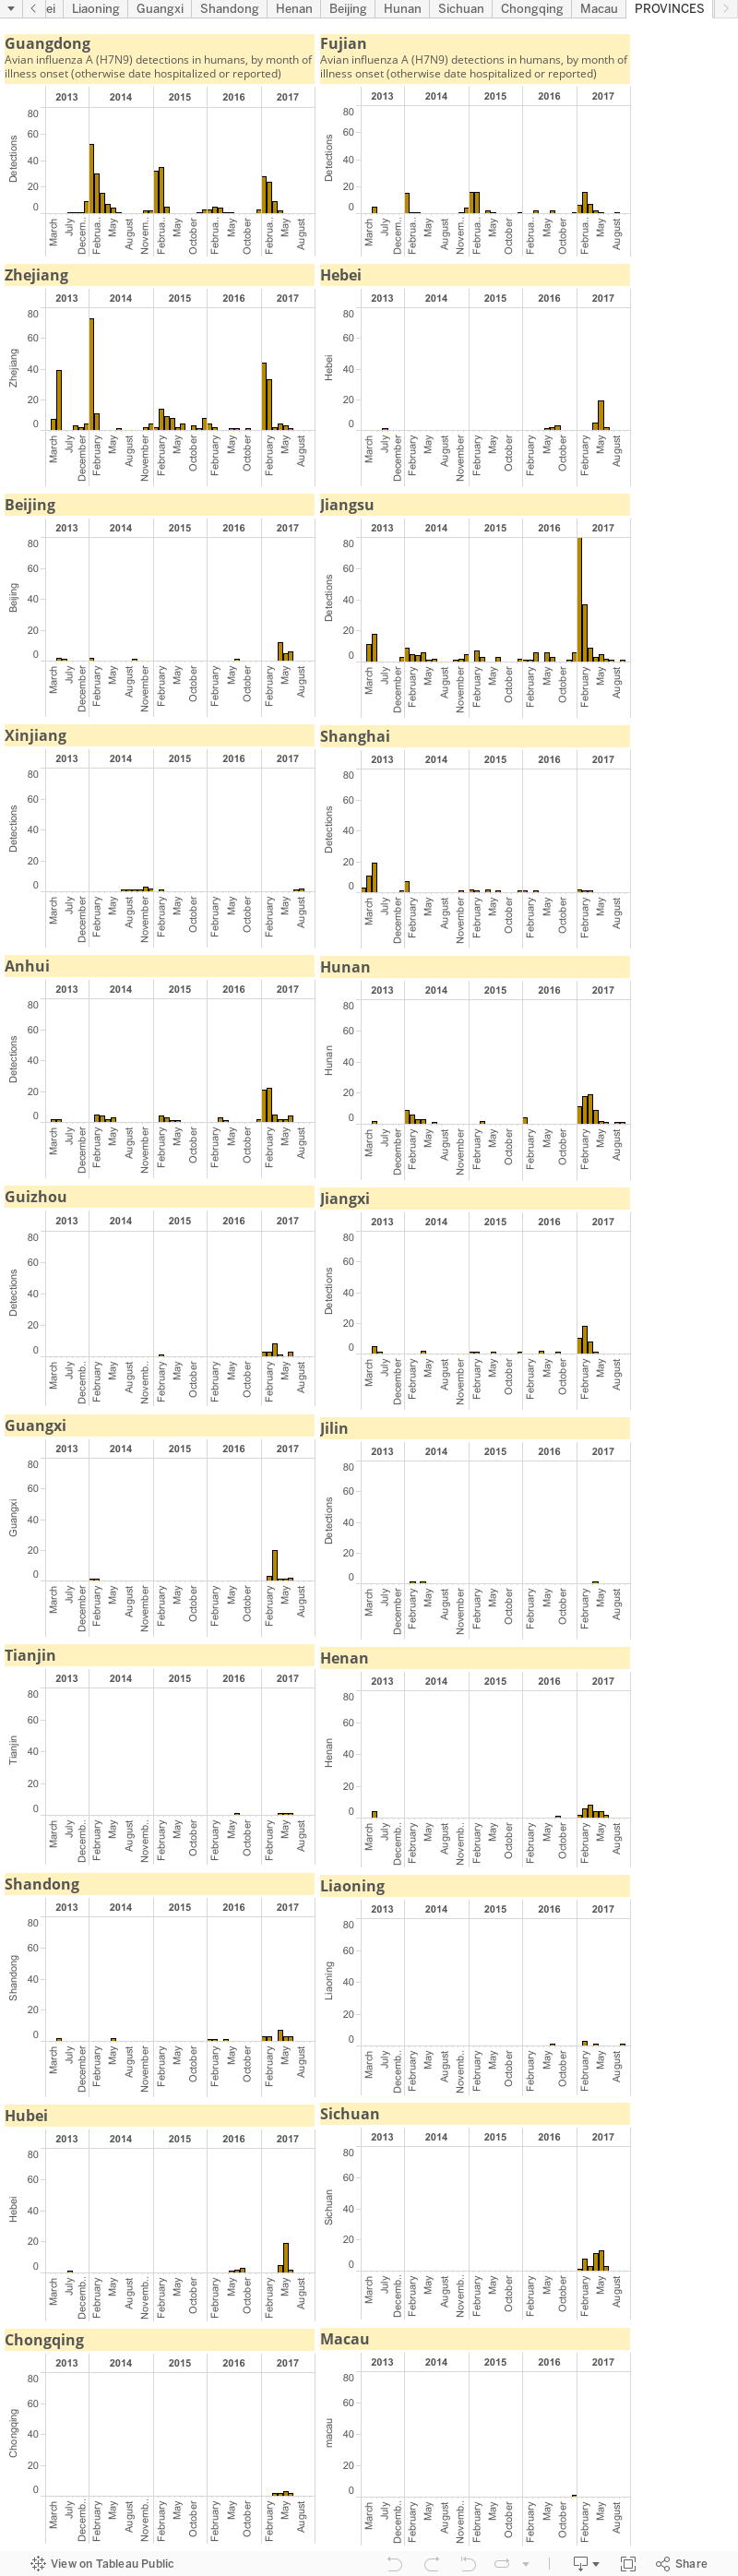
I've graphed these wrangled data using one of my older formats - to show which province, municipality or autonomous region is contributing to the peaks as the site of origin for an H7N9 case.

Sometimes where a case has been detected may not be where they were infected. I prefer to talk about where a case "acquired" their infection. 

Click on image to enlarge.
Data for this graph can be downloaded from my static H7N9 graphs page, here.[9]
We can see - perhaps - that the major contributors to the peaks in January and February's 5th Wave are Jiangsu province (green circles) followed by Zhejiang province (orange circles) then Guangdong (brown circles), Anhui (purple circles), Hubei (red squares) and a range of smaller contributor regions.

Guangdong and Zhejiang are familiar to H7N9 watchers as being hotspots for human spillover and while Jiangsu has always had a presence in the outbreaks, it has had a very big season this time around.

It remains to be seen whether a range of market live poultry market (LPM) closures has cut the flow of virus into these markets and to their many, many visitors. These closures have been in response to cases rather than to prevent the outbreaks but no obvious nationwide coordination is apparent. It seems likely that spread of infected fowl will continue until more markets close, the source is contained or the seasons for influenza spread (winter and colder shoulders) is over.

Stay tuned to the CHP update this week - last week's tally was lower than previous weeks; a blip or a trend? 

A few things about this graph.
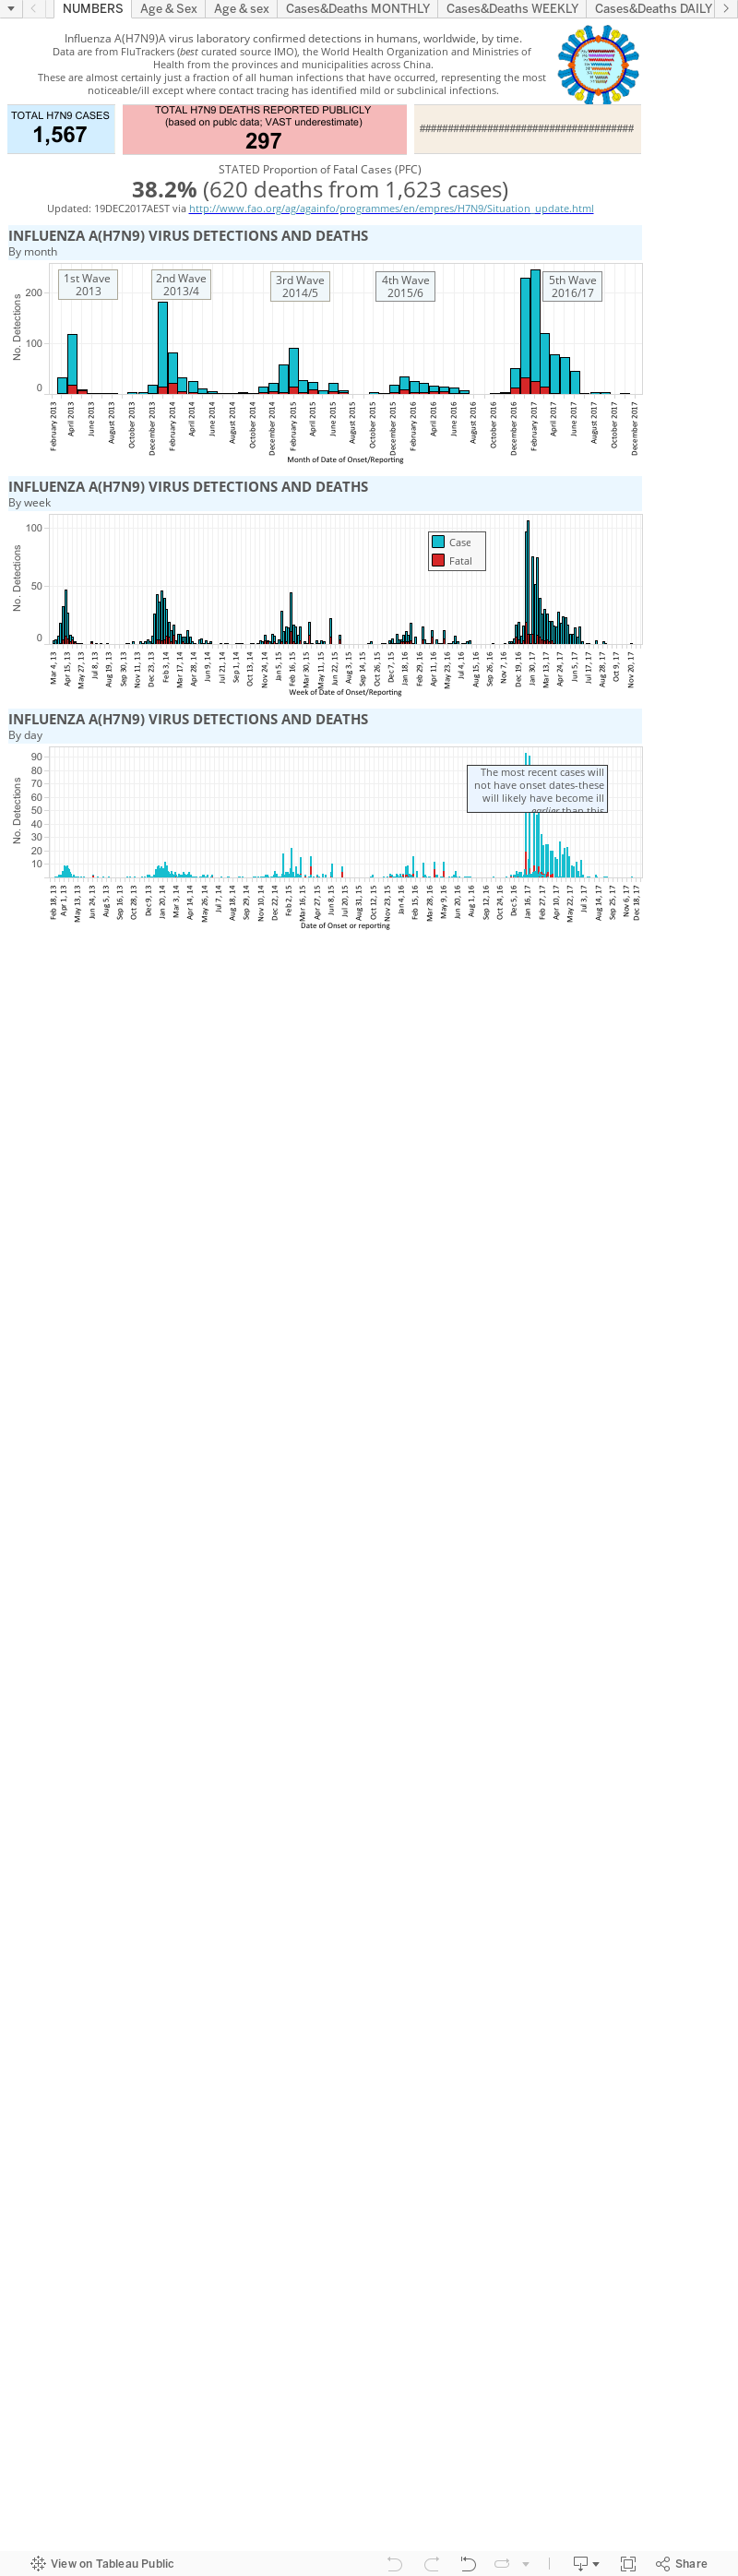
  • It mirrors the FluTracker's line list numbering scheme up until FT816. From entry No. 817 it uses data from the CHP reports. These are PDFs but as they helpfully told me by email this week - you can extract the data yourself using Adobe Acrobat Pro. If you don't have that - I've already done that extraction and am happy to share an Excel version of it with you. Shoot me an email, leave a message or Tweet me
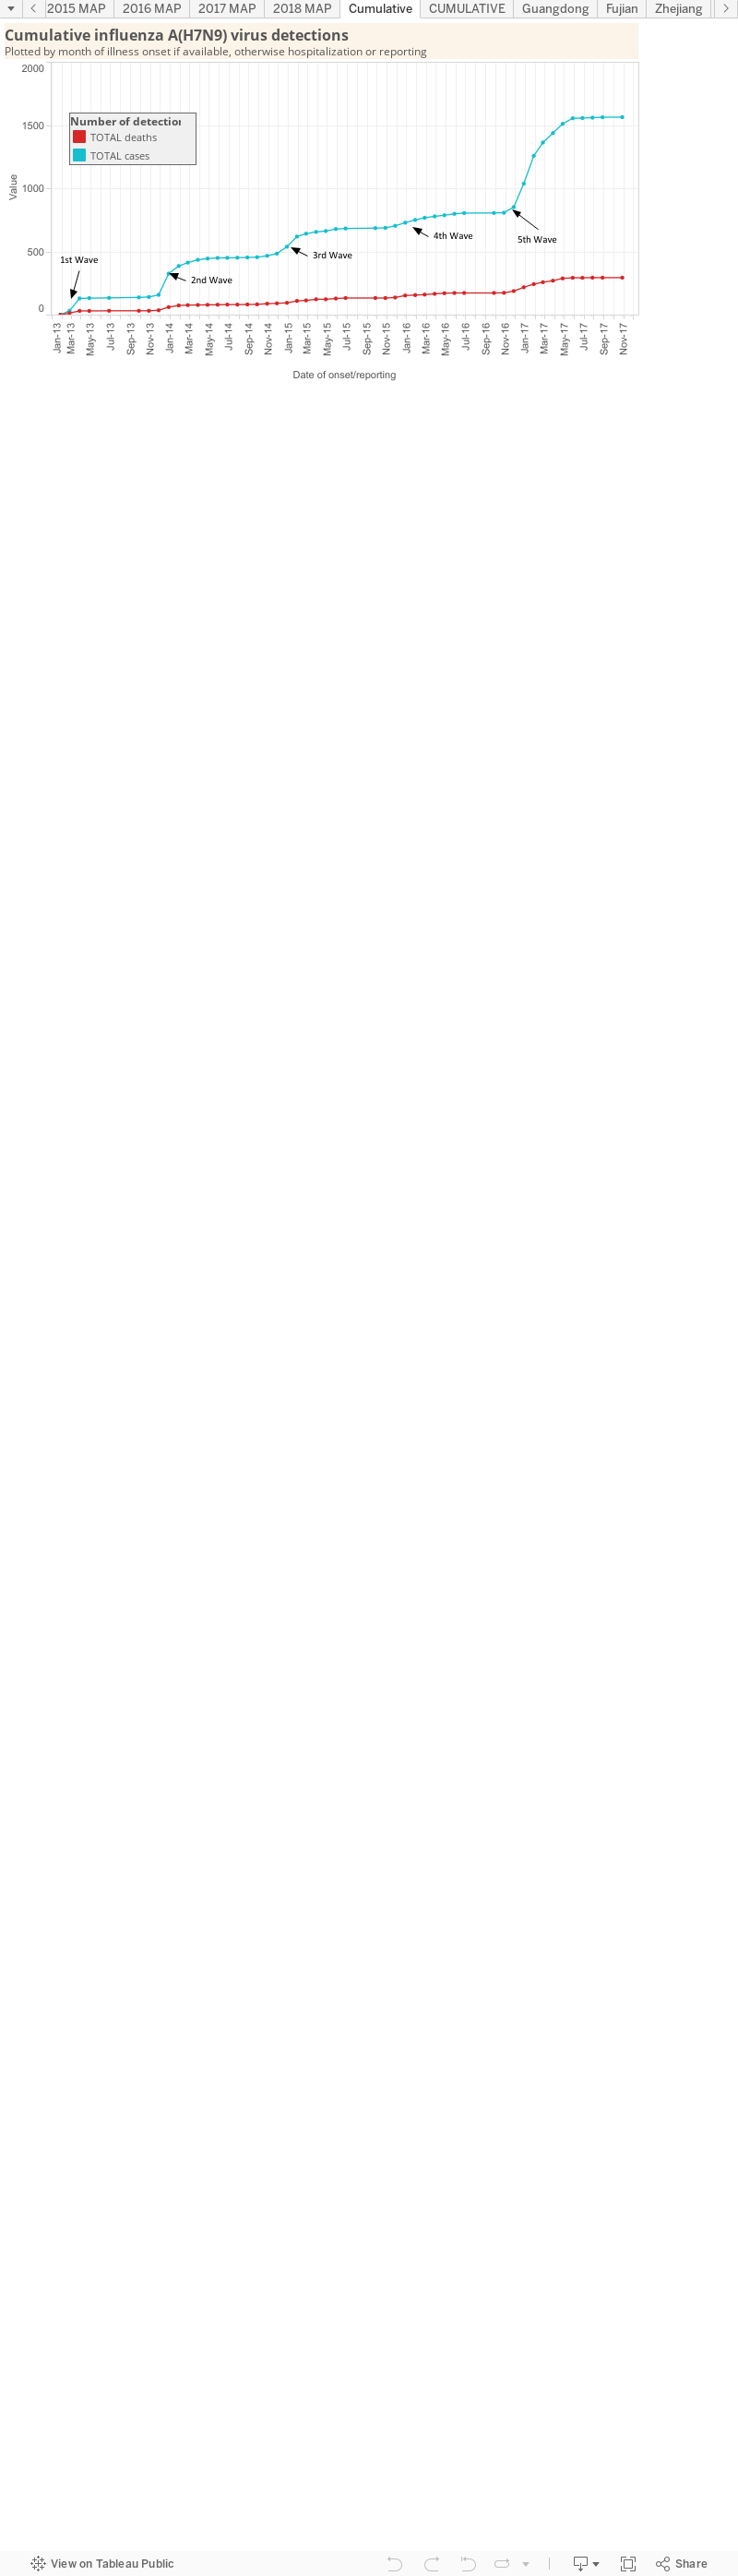
 @MackayIM.
  • The Outbreak numbering - or waves - is based on when cases appeared or stopped. Its imperfect too. There are published schemes but they also differ from each other [e.g. 7,8]. This isn't life or death - you get the idea from the obvious peaks and troughs. FYI - this year I've updated my numbering for previous outbreaks.
  • Market closures include long term or short term shutdowns or rotating closures for one or more days for disinfection followed by restocking. Each province is a populous place. Often markets are closed here or there but not everywhere in a province and certainly not all provinces at once. 
  • Data are plotted by week of illness onset (hard data to come by) or when the case was reported. The grey peaks indicate totals from all provinces for that week
References...
  1. http://www.chp.gov.hk/en/guideline1_year/29/134/332.html
  2. https://flutrackers.com/forum/forum/china-h7n9-outbreak-tracking/143874-flutrackers-2013-17-human-case-list-of-provincial-ministry-of-health-government-confirmed-influenza-a-h7n9-cases-with-links?t=202713
  3. https://www.cdc.gov/flu/avianflu/h7n9/case-definitions.htm
  4. http://www.phac-aspc.gc.ca/eri-ire/h7n9/case-definition-cas-eng.php
  5. http://ecdc.europa.eu/en/publications/publications/h7n9-interim-case-definition-april-2013.pdf
  6. http://www.who.int/influenza/human_animal_interface/influenza_h7n9/InterimSurveillanceRecH7N9_10May13.pdf?ua=1
  7. http://ecdc.europa.eu/en/publications/Publications/rra-influenza-a-h7n9-update-five.pdf
  8. https://bmcinfectdis.biomedcentral.com/articles/10.1186/s12879-016-2049-2
  9. http://virologydownunder.blogspot.com.au/2014/11/influenza-ah7n9-virus-detection-numbers.html

Friday, 27 January 2017

H7N9 is having a big season...Happy New Year!

My how things can change in 5 weeks. 

If you look back a few posts you'll see that in late December, the data suggested avian influenza A(H7N9) virus was having a wimpy season - its slowest to date. 

Well, thanks to 100+ cases in China which have been bulk reported by the ever vigilant Hong Kong Centre for Heath Protection (CHP) - and captured and listed by FluTrackers - the situation has changed dramatically. 

Never take your eye off influenza virus - especially during its favourite season. And this season is a particularly active one for avian influenza all over the world.[4]

H7N9 is an avian influenza virus (hence the  "bird flu" moniker) that to date has been localised to China - especially but not exclusively to its eastern coast provinces - and it's a flu virus that doesn't make the birds it infects noticeably sick. 

These "low pathogenic" influenza viruses can sneak silently through poultry flocks because infections are mild - they don't cause infected birds to get sick or die. 

Data on human infections with avian influenza A(H7N9) virus. Data from [1]
Click on image to enlarge.
The H5 avian influenza viruses on the other hand - H5N1, H5N8, H5N5 or H5N6 for example - are called "high pathogenicity" avian influenza viruses because they kill off infected birds. Thankfully, H5N1 is the only H5 avian influenza that has caused a sizable number of human infections. H5N6 is gaining some ground though. The other H5s do not reportedly cause much impact in humans. Whether this is because they are not found or not sought in humans who have had contact with infected animals is unclear.

Disease in an H5-infected flock can serve as a sentinel for an outbreak of the virus. 

With H7N9 though, it's humans falling ill that set of the alarm that H7N9 (or another influenza virus) is in the house...or the market. And there are a sizable number of deaths among those - often male - who already have some sort of underlying illness and then acquire an H7N9 infection.

Most human cases of H7N9 result from contact with a "wet" market, also called a live bird market (LBM) in which chickens and ducks can be chosen, killed and dressed to provide a super-fresh meal. These tasty treats are especially in demand around this time of year as Chinese New Year is upon us. 


Chinese New Year is also a time when we observe the largest seasonal migration of humanity in the world. [2] Loved ones travel across a massive country to visit each other, share stories, traditions, meals - and the occasional respiratory virus like influenza. 

From [3].
In the coming weeks, as the gatherings disperse, it will be very interesting to see whether the current spike in human H7N9 infections is reflected by a steep rise in human cases acquired during the New Year celebrations - some of which include contact (direct or indirect) with infected poultry in backyard farms or LBMs.

Stay tuned. And don't forget to wash your hands often and cough/sneeze into the crook of your elbow.

References...

  1. http://virologydownunder.blogspot.com.au/2014/11/influenza-ah7n9-virus-detection-numbers.html
  2. https://www.nytimes.com/2017/01/26/world/asia/chinese-new-year-home-lunar.html?_r=0
  3. https://www.cdc.gov/flu/protect/covercough.htm
  4. http://news.trust.org/item/20170126150919-05z2c/

Monday, 26 December 2016

Snapdate: influenza H7N9 cases in humans, by the numbers...

An updated chart.
[SNAPDATE'S are snap updates that don't have lots of detail and chat...although they almost always end up having lots of chat!]

A summary of the monthly, weekly and daily data graphing human avian influenza A(H7N9) virus infections in humans reported from the hotzone, China.

Daily weekly and monthly H7N9 numbers, taken from the
FluTrackers curated line list [1] and the World Health
Organization disease outbreak news reports
.
Click on image to enlarge.

References...

Friday, 23 December 2016

H7N9:2016 has been the most quiet year to date...

Influenza A(H7N9) virus, or 'H7N9', has had a quiet year when compared to past outbreaks.

All human cases to date have been linked to China. The majority of human cases have had some link with poultry - chickens or ducks - although we do hear of human-to-human transmission, this seems to be limited. H7N9 has been found in poultry from backyard farms and in live poultry markets (LPMs) in China - sometimes in the company of other influenza viruses, like H9N2.[1]

Cases and deaths each month over the 4 years we have known
about human cases of H7N9 infection.
Click on image to enlarge.

Despite the slow year,the 2016 graph above shows the usual December uptick in human cases. It will be what happens next that matters. Will be see a big January surge as in 2014, or a later Feb-April surge as in 2013 and 2015? Will live LPMs be quickly closed, disinfected, the animals destroyed and any outbreaks in 2017 squashed or will they remain open allowing more human cases as the virus spreads among market animals?

Time, and testing data - which China generates lots of but does not seem to enjoy publicly reporting - will tell.

In 2016 - 2 new regions were added for the first time - Tianjin municipality and Liaoning province - both in the north-eastern coastal region of China. 

In 2013, no sustained human-to-human transmission had been reported [2] - this remains true up until today.

References...

  1. https://www.ncbi.nlm.nih.gov/pmc/articles/PMC4911810/pdf/nihms749408.pdf
  2. http://www.nature.com/news/mapping-the-h7n9-avian-flu-outbreaks-1.12863

Sunday, 28 February 2016

Avian influenza A(H7N9 virus...a primer...

Influenzavirus taxonomy
OrderUnassigned
FamilyOrthomyxoviridae
GeneraInfluenzavirus A, Influenzavirus B, Influenzavirus C
SpeciesInfluenza A virus, Influenza B virus, Influenza C virus
Genome(-)ssRNA, 7 (IFCV)- 8 (IFAV/IFBV) segments (~14kb total length)
GenesPB2, PB1, PA, HA, NP, NA, M, NS
VirionEnveloped, approximately spherical, 80-120nm
NB-this has just been transferred from my old VDU website to this blog and so is out of date. I'll update in the future

One of the most recent avian influenzavirus strain added to the list of agents causing "bird flu" is called avian influenza A(H7N9) virus - a colourfully exciting reference to its key surface proteins (see influenza background). H7N9 is considered a low pathogenic avian influenza virus (LPAIV)...at least in its feathered hosts. Avian influenza A(H7N9) virus (which I may shorten to H7N9 to save my fingers) was once considered a relatively rare cause of infection although how extensively and routinely it was looked for in the past is unclear. Avian influenza A(H7N9) virus is similar to its closer cousins, H7N2, H7N3 and H7N7 and its more distant cousin H5N1 in that they are all IFAVs and they usually infect birds. However, they are each quite distinct and made up of different genes.

Avian influenza A(H7N9) virus is an IFAV (see the adjacent schematic) that has evolved in birds. The virus has 8 single-stranded RNA segments that encode 11 proteins. However, when cases of infection by it were reported for the first time in humans (China, March 2013; very general locations of confirmed cases to date are shown in the map), it was linked to its first two deaths in this host (an 87 year old male [87M, sick 19.02, died 04.03; 2 family member(s) also reported ill with pneumonia but H7N9 negative] and a 27 year old male butcher [27M, sick 27.02 and died 10.03], both in Shanghai, China) or critical illness (35F in Chuzhou city). 


Since 2013, cases have slowly but continuously climbed.

Because there is a delay between illness onset and laboratory confirmation of 10-13 days, the newest cases started have illness onset dates some way back making it is still hard to judge the impact of control measures like live animal market closures and animal culling, on interrupting transmission. A timeline of the early events shown below. 


Use images freely but please cite this blog and Dr. Ian M Mackay as their source.
Click on image to enlarge.


The chart to the left divides the H7N9 outbreak into its 2 Waves based on laboratory notifications made public starting from March 31st (Chinese CDC notified WHO). 


In the graph of the accumulating confirmed cases to the right (blue mountain), fatalities (red) and the rolling proportion of fatal cases (grey-PFC calculated using public data, yellow using media reports of totals), we can see that the total proportion of fatal cases (PFC) sits around 30%. Please don't go nuts and draw any major conclusions based on extrapolating the PFC to the global population - this figure is solely meant to show you the numbers and trends at the site of the outbreak among those people being affected. It cannot be translated widely. What it does show us is how the outbreak came to be noticed - fatalities. The PFC remained fairly steady though 2013, although its calculation is at the mercy of the availability and extent of public data. For an update on the most recent epidemiology, please visit my blog, virologydownunder.blogspot.com.au  and use the search box to find recent “H7N9” posts. 


H7N9 Fataliaties by week. Use images freely but please cite
this blog 
and Dr. Ian M Mackay as their source. Click on image to enlarge.


The various H7N9-positive municipalities (Shanghai and Beijing) and provinces (e.g. Henan, Anhui, Zhejiang, Guangdong, Jiangxi, Hebei, Fujian, Hunan and Jiangsu) in southeastern China have had different numbers of cases reported and the reports started at different times. The first cases were confirmed from Shanghai on March 30th and included the first case who showed signs darting back to February 19th. Jiangsu's first confirmed cases occurred 30-March-2013 (although they were not announced until 2-April-2013) then Anhui province followed (confirmed on 31-March-2013) then Zhejiang province (1st April-2013), Henan province (11-April-2013) and Beijing reported its first case 13- April-2013. Guangdong province confirmed its first case 6-August-2013; Fujian province, 26-April-2013; Hebei province, 20-Jul-2013; Shandong province, 22-Apr-2013; Guangxi province 29-Jan-2014; Jilin reported its first detection, 21-Feb-2014. Most cases in Wave 1 were from Zhejiang province which was also a major site of virus activity in Wave 2, along with Guangdong province.


The denominator problem...


You may remember from your early maths classes that fractions have both a numerator (the number on on top or before a slash/line, that represents a portion of the whole) and a denominator (the non-zero number on the bottom or after the line that represents all the parts of the whole).  avian influenza H7N9 flu cases by area of China The avian influenza A(H7N9) virus outbreak in March-May 2013 mostly manifested as severe disease - those people being admitted to hospital needing help to breathe (requiring oxygen or mechanical ventilation) - and we did not see many mild or asymptomatic cases (virus positive but no obvious feelings of signs of illness). This might be because there were no mild cases (although a couple popped up in children and adults) or because only the worst cases were tested. In favour of the former hypothesis, enhanced surveillance in China found few H7N9-positive cases of mild disease - the most notable being children. 

Many milder respiratory diseases look the same based on signs and symptoms but can be caused (and I use that word with caution) by many, many different respiratory viruses. There may be cases of respiratory infection going around in China that are H7N9-positive but not severe enough to warrant a admission to hospital or even a trip to the Doctor. Until we know more about this part of the H7N9 story, we won't know the total number of avian influenza A(H7N9) virus infections that are occurring, so we can't calculate the true denominator. More info on this in a recent article.

If the denominator is small (like it is now with so few H7N9-positive cases and those being from mostly severe illness or deaths, then we see a high proportion (percentage) as our Proportion of Fatal Cases  (x severe cases over a small number of total cases is a high proportion). If there are mild cases of avian influenza A(H7N9) virus infection out there (as we saw early examples of 15-Apr-13) and they are in large numbers, that denominator could be much larger and the severe disease cases will be "diluted" down to a smaller proportion (x severe cases over a large number of mild and severe total cases is a low proportion).

Monday, 4 May 2015

The third outbreak of influenza A(H7N9) virus seems to be over...

Cumulative curves of reported H7N9 cases and deaths in humans.
Click on graph to enlarge.
By the looks of the curve on the right, the rush of cases that defined the third known outbreak of the low pathogenicity avian influenza A virus subtype, H7N9, is over...for another season anyway. 

If we get into the nitty gritty, as I have below, there are a couple of interesting things to see. First though - let us remember that these are just reported data:

  • there may have been some cases that were not reported for whatever political, medical, social or personal reasons - these data are an idea of what happened - look at the rends and don't get hung up on the specific values
  • the overwhelming majority of the cases have reported to a healthcare facility with respiratory disease due (presumably) to either infection - we have no idea how many other people have been infected, what proportion were mild or asymptomatic (as I've discussed e.g. here and here, so we know it is possible). It could be half as many again, or 100 or 1,000 times as many.
  • these are only cases that have been examined with a laboratory test (as far as we know) - there may have been many other cases of "influenza-like illness" that did not get sampled and tested but were managed under (or not) the assumption that they were influenza of some type, subtype or strain.

Please note-the graphs used here can all be found on my fixed interactive H7N9 page at:http://virologydownunder.blogspot.com.au/2014/11/influenza-ah7n9-virus-detection-numbers.html

The interesting stuff includes:

  • For the 2 outbreaks we have continuous data for - 2013-14 and 2014-15, the start of the outbreak seems to be around October/November, with the peak around January/February. 
  • Outbreak 3 did not seem to reach the heights of the preceding year however, from what we could glean from pretty poor data, the link to poultry exposure was as strong as ever. Perhaps market closures in response to deaths were a little more effective/efficient/wide-ranging in Outbreak #3? Pure speculation

Click on graphs to enlarge.
  • Most of the cases in 2015 (bottom maps) were on the east coast of China

Click on map to enlarge
  • Most of the activity in the 3rd outbreak was focussed in Guangdong, Fujian and Zhejiang provinces (the red ones above) 
  • Xinjiang Uyghur Autonomous region (in the far west) and Guizhou and Hubei provinces joined the list of host regions in Outbreak #3
  • Xinjiang joined Guangxi and Jilin provinces (which reporting cases in Outbreak #2) as regions of China that share a border with another country - heralding the movement of this H7N9 variant beyond China's borders possibly into Vietnam, North Korea, or a -stan
Click on graphs to enlarge.
Keep an eye out for H7N9 Outbreak #4 - coming to a colder China around November 2015. 

But for now, it might be time to hit the FluTrackers line lists (okay, I've had 4 tabs open for ages) and graph the course of another source of concern - H5N1 cases in humans.

Tuesday, 27 January 2015

Societal change and H7N9..

The importance of societal change for controlling infectious disease outbreaks really cannot be over-stated. 

For Ebola virus disease, it came down to stopping the tradition of direct contact with the body of those who have died and dircet contact in general. For MERS it
seems that occasional camel contact triggers insertion of the MERS-CoV virus into hospitals where lax infection prevention and control practices add to the case load. 

For influenza A(H7N9) virus cases, it is the habit of obtaining live poultry from retail markets where rare virus-laden chooks are culled and handed over because of a desire to see, choose and purchase the tastiest fresh chicken. 

There is a common thread among these stories about direct contact or inefficiently droplet-transmitting virus infections: we can stop their spread. 

But we also amplify and prolong their spread. 

However, when it comes to human-adapted, efficient droplet-spread or airborne-transmitted viruses - well, then we're in trouble. Of course we could all just lock ourselves in a room for a few weeks but that won't ever happen.

So its very important to head off these "emerging" viruses while we still have a modicum of control over them. Once they get away from that control, and theoretically that could happen in the blink of an eye-right now even-no amount of fancy infra red cameras, poorly donned surgical masks or fancy hospitals laden with machines that blink and go ping, will stop them from spreading globally.

Cheery.

In the meantime - here's hoping China speeds up the closure of those live poultry markets. Habits can be changed but death is forever.

Click on image to enlarge.

Saturday, 3 January 2015

H7N9 outbreak #3 underway?

What better way to start 2015 than a snapdate!! For those who are new to them here on VDU, they were initiated here and defined here as snap updates - posts that don't have lots of detail and chat...although they almost always end up having lots of chat!

Figure 1. H7N9 cases by week of onset (or hospitalisation
or reporting dates of the preferred onset date was
not made public).
Click on image to enlarge.
This one is an update of the situation of one of the many avian influenza viruses ("bird flus" if you must) around again - avian influenza A(H7N9) virus, or just 'H7N9'.

In Figure 1, I've taken the huge liberty of adding in the start and end dates of the 3 outbreaks of H7N9 to date; and in doing so, I've said that China is in the early stages of one right now. I may well be wrong of course - this is a blog and these are my opinions - but it looks that way to me. 

Figure 2. China's northern laboratory network influenza
surveillance data up to Week 51 of 2014. [1].
Click on image to enlarge.
The case numbers for H7N9 in Figure 1 have been above zero for a little while and in particular November looked like a busy month (see weekly and monthly tallies here). Keep in mind that there is also a reporting lag - the time between date of onset (obtained from more detailed World Health Organization data) and the date the case was publicly reported (I rely on FluTrackers line list for these details). That delay can be a month or more on occasion; up to 38-days in late December. I suspect this is because China reports cases to the WHO in batches, something instigated toward the end of the 1st and 2nd outbreaks. So I suspect we will see more cases assigned to December, during reports that come out in January.

But it look like 'tis the season for influenza in humans in China (see figure 2 and the Chinese National Influenza Centre [2]) - and as some of us have discussed on Twitter, this is most probably due to the changes in weather (environmental conditions) which result in sustained viral survival on cough and sneeze-contaminated surfaces and in wet and dry propelled droplets and droplet nuclei; in both man and bird (see Hong Kong avian influenza detection report dates [3]). 

That sustained survival may well be all it takes for more of us to pick up an infectious viral dose.

Once the seasonal influenza viruses get a foothold in us, they spread well, causing disease in those who are susceptible and probably a bunch of unnoticed infections in those with previous exposure to that strain plus a healthy immune memory of that intrusion. By "seasonal influenza virus, I mean those that replicate in and circulate efficiently among humans, as opposed to the relatively inefficient avian subtypes.

So stay tuned to H7N9; it's not yet very good at spreading between humans but its established in birds and has been spilling over into humans since at least the beginning of 2013. We know how influenza can deal us a rough hand if the stars and its genetic segments align favourably (for it). Oh, and the continued reliance on fresh chicken obtained from and killed at live poultry markets. The majority of cases have very clearly had contact with poultry as defined by the WHO. 

References...

  1. http://www.cnic.org.cn/eng/show.php?contentid=738
  2. http://www.cnic.org.cn/eng/surveillance.php
  3. http://www.chp.gov.hk/files/pdf/global_statistics_avian_influenza_e.pdf

Friday, 2 January 2015

Influenza A (H5N6) virus in humans...

Provinces hosting human cases of H5N6
Adapted from [8]
Click on image to enlarge.
After late December's announcement of a human infection with another avian influenza subtype, H5N6. The tally of human infections by this subtype of FluA stands at 2 - that are reported anyway.

The ever vigilant @FluTrackers (and their line lists, news posts and commentary) and the always alert @Fla_Medic (and his Avian Flu Diary blog) have these cases well covered.

I just wanted to make a summary here for my own reference in making some slides for a talk next month.
  1. ~23-April-2014. [1,4,5] 49-year old male (49M) from Nanchong City, Sichuan Province.
    Acute severe pneumonia, died 5-May-2014
    Exposed to dead poultry
  2. 3-December 2014. [2] 58M from Guangzhou City in Guangdong province.
    Critical condition in hospital since 9-Dec-2014
    Exposed to live poultry but not ill contacts [3]
There have also been plenty of lethal animal infections by this and other highly pathogenic avian influenza (HPAI; referring specifically to the bird's outcome) subtypes and strains [7], including:
From an OIE Report 21-Oct-2014. [6]
  1. 12,000 quails in Quang Nai Province, Vietnam in 18-Dec-2014
    http://en.vietnamplus.vn/Home/Quang-Ngai-destroys-12000-AH5N6-infected-quails/201412/59394.vnplus
  2. 1,338 birds on a farm in Nanbu, Nanchoing City, Sichuan Province, China
    http://www.oie.int/wahis_2/public%5C..%5Ctemp%5Creports/en_fup_0000015698_20140731_162951.pdf
  3. 20,550 (17,790 fatal) birds on a farm in Shuangcheng District, Heilongjiang Province, China, 23-Aug-2014
    http://www.oie.int/wahis_2/public%5C..%5Ctemp%5Creports/en_fup_0000016060_20141024_193420.pdf
  4. Birds in Muang Nan and Muang Xayabouly Districts, Luang Prabang and Xayabouly Provinces, Laos in 12:14-Mar-2014
    http://wwwnc.cdc.gov/eid/article/21/3/14-1488_article#r4
No sign of anything like sustained human-to-human transmission of this viral subtype to date. But another for the influenza virus Rubik's cube.

References..
  1. https://flutrackers.com/forum/forum/china-h5n1-h5n8-h5n6-h5n3-h5n2-h10n8-outbreak-tracking/164419-china-man-49-with-acute-severe-pneumonia-died-from-h5n6-nanchong-city-nanbu-county-sichuan-province?t=222782
  2. http://www.who.int/csr/don/28-december-2014-avian-influenza/en/
  3. http://news.xinhuanet.com/english/china/2014-12/23/c_133874590.htm
  4. http://afludiary.blogspot.com.au/2014/05/sichuan-china-1st-known-human-infection.html
  5. http://www.promedmail.org/direct.php?id=2451125
  6. http://www.oie.int/wahis_2/public%5C..%5Ctemp%5Creports/en_fup_0000016060_20141024_193420.pdf
  7. UPDATE ON HIGHLY PATHOGENIC AVIAN INFLUENZA IN ANIMALS (TYPE H5 and H7) from the Office International des Epizooties (OIE), otherwise known as the World Organisation for Animal Health
    http://www.oie.int/animal-health-in-the-world/update-on-avian-influenza/2014/
  8. http://en.wikipedia.org/wiki/File:China_administrative_claimed_included.svg#filelinks

Sunday, 2 November 2014

Influenza A(H7N9) virus: detection numbers and graphs...

This is a static page that houses my graphs of influenza A(H7N9) virus ("H7N9") numbers produced by the various Ministries of Health for the provinces and municipalities of China, Hong Kong's Centre for Health Protection (CHP) the World Health Organization and FluTrackers.

Please be aware that these numbers are in flux during the winter epidemic. They are a guide only.

There is also an accompanying map page which for now is located here.


Reminders: 
  • The graphs above, as with all on VDU, are made for general interest only. They are also freely available for anyone's use, just cite the page and me please. The data can be downloaded by clicking on the "Download" link at the bottom-right of each dashboard. It may be that I have misinterpreted the language in the reports (sometimes a little tricky to wade through) or miscalculated some totals based on the way data have been presented.
  • In any outbreak, epidemic or pandemic caused by a know or emerging pathogen, the numbers presented publicly, and used in these graphs, are expected to represent only a fraction of all the cases that have and are occurring. This is just the nature of the imperfect biological'ness of these events.
  • I am only able to plot what is publicly available-you could do this too. No secret associations or back-room deals provide me with these data.

Sunday, 20 July 2014

Now for something (not so) completely different: H7N9 maps...

Now it's time to mess around with influenza A(H7N9) virus mapping using Tableau.

I've (only just) realised the my esteemed peer, Shane Granger has been using Tableau to do this for ages (see here), and that this will be duplicating his excellent work. So I'll try my best to consciously differentiate my maps from his - but there's only so far you can go with that and there will be overlap. 

The page below is a very early first play with H7N9. It's just detections broken across 2013 and 2014, by province most likely to have been the source of the infections (as far as I can tell) in mainland China. 

If I can master this I'll try and add more details in the future. For now, these numbers a a little out of date but he trends are similar. This charts 449/452 detections.


Thursday, 22 May 2014

Snapdate: Avian influenza A(H7N9) virus...

There seem to have been more announcements of late than previously so I thought I'd plot this and see. 

These are a little adrift as the last 7 or so have not been through the WHO scrubbing process (which adds extra bits of data) so we will see a little shifting the last 2 or so blue dots on the chart below.
Click on image to enlarge.

Guangdong and Anhui provinces have the most active case generators in May.

Anhui province has reported 3 cases in a week and there seem to have been a constant stream of cases in May, but they they don't, in reality, seem to be out of what's become the ordinary in 2014 for a virus that is happily ticking over in several provinces.