Showing posts with label influenza virus. Show all posts

Friday, 25 December 2015

Avian influenza A(H7N9) virus case data in humans: more chicken scratchings

This is an example of a 2015 case announcement from the World Health Organization (WHO). I think it aims to provide information on some avian influenza A(H7N9) cases that occurred in China.

From WHO Disease Outbreak News (DON) at
http://www.who.int/csr/don/15-june-2015-avian-influenza-china/en/
I suppose it does do that in the most basic sense. Yes, if you were a casual electronic browser to the WHO disease outbreak news site (...get out more!) then you would learn of 15 additional human cases of disease presumably due to H7N9 infection. Twenty percent of these cases died and this happened within a month. 

But consider these questions for a moment:

  1. Why would you visit the WHO to learn of this, if you were not seeking some actual detail and evaluation of risk?
  2. If you were a casual browser, I expect you would come away from this with some out-of-context concerns about a bolus of cases in such a short period, spanning a wide age range and occurring across considerable geographic distance. Should you be worried? Is this the precursor to some larger outbreak? Each difficult to answer from this very small cross-section of information.
  3. These public data are relied upon by some when they write papers or release infectious disease reports - so why not include key - yet deidentified - demographic detail in a line list format - remember MERS-CoV in South Korea anyone? That WHO list [4] was messy [5] but it was a step forward for those outside the WHO network who wanted free, publicly available basic data, quickly
In my opinion, the premier emerging disease tracking and publishing - at least in terms of accessible, basic, rapid, searchable, freely accessible and up-to-date emerging infectious disease information - is the team at FluTrackers. Keep your predictive modelling - I'd trade it all in for a clone army of these guys any day! The FluTrackers line list on H7N9 includes some of these cases[6]...and as you can see in the snippet below, even their scouring of the media from China does not help to fill in the data gaps on these cases...
From FluTrackers' H7N9 line list at
https://flutrackers.com/forum/forum/china-h7n9-outbreak-tracking/143874-flutrackers-2013-15-human-case-list-of-provincial-ministry-of-health-government-confirmed-influenza-a-h7n9-cases-with-links?t=202713 [6]
So why does the WHO bother with this information at all? I can't speak for them. But one reason may be because it is relied upon by those who study and prepare for the emergence of new or re-emergence of old infectious agents.[1] These people consume this sort of information to track what's happening outside their own back yard and to weigh the risks that a new bug may come knocking at the gate thanks to a speedy international plane flight. But when the host country is slow or perhaps even reticent to identify key case details, a knowledge gap emerges and may widen. This particular gap has been growing since 2014's H7N9 3rd wave. Perhaps since the 2nd wave.

When sufficient - or any - detail is lacking, then it comes down to the public to look for any answers they seek...by themselves. In this case, that has been FluTrackers & Co; this source has proven itself very worthy for this and for other viral threat monitoring, but cannot be expected to fill this need indefinitely.[2,3]

H7N9 is a good example of an absence of obvious change to the flow of information that the world's public, citizen scientists and its more professional scientists receive about new infectious threats. And this is all a bit strange because I was sure we'd heard a lot about the need to do much, much better on this sort of tracking and chatting in 2014/5 during one of the biggest modern moments of being "caught with our pants down" - the Ebola virus disease epidemic.

Time and viruses wait for no person. Be faster.

Ho. Ho. Ho.

References...

  1. http://ecdc.europa.eu/en/publications/Publications/RRA-Influenza-A-H7N9-update-four.pdf
  2. http://www.ncbi.nlm.nih.gov/pubmed/24885692
  3. http://www.ncbi.nlm.nih.gov/pmc/articles/PMC4140362/pdf/jphr-2012-2-e29.pdf
  4. http://www.who.int/emergencies/mers-cov/MERS-CoV-cases-rok.pdf?ua=1
  5. http://virologydownunder.blogspot.com.au/2015/06/matching-mers-case-identification.html
  6. https://flutrackers.com/forum/forum/china-h7n9-outbreak-tracking/143874-flutrackers-2013-15-human-case-list-of-provincial-ministry-of-health-government-confirmed-influenza-a-h7n9-cases-with-links?t=202713

Saturday, 8 August 2015

Queensland influenza sees a shift in age...

Image adapted from Geoscience Australia,
The Australian Government.[3]

The media Down Under have been doing their thing this influenza season...

...lots of inflammatory (pun intended) headlines to make us all fear just about everything and everyone. Blah.

Nonetheless, it is flu season down here - and hopefully you gave vaccination a try this year, or you got your annual shot. Top marks if so! If you can safely and pretty painlessly dodge a preventable disease, save yourself some misery, avoid making your kids sick - who will require time off to be looked after, not make Aunty Robyn crook as a dog and not put Grandad's ailing ticker under extra stress...why wouldn't you? 

VDU Figure 1. Figure 2 from the State of
Queensland (Queensland Health) report
found here.[1]
Click on image to enlarge
Thanks to the excellent and publicly available wealth of data presented by the epidemiologists of the State of Queensland (Queensland Health), I talked about influenza in Queensland and the distribution of types (i.e. Flu A or B) and subtypes (e.g. H3N2 or H1N1) last year.[2]

In 2014, influenza A viruses were the big bad, but in 2015, as we can see in VDU Figure 1 (orange), influenza B viruses are ruling the mean streets.

VDU Figure 2. Appendix 1 from the State of
Queensland (Queensland Health) report
found here.[1]
Click on image to enlarge
From the look of VDU Figure 2, the influenza season remains in full swing (hint-get that vaccination if you haven't already). 

VDU Figure 2 also shows that things are not tracking all that unusually for a Queensland influenza season when you compare this year to curves from the past 5 years. So I'd suggest taking those media headlines with a box of tissues!

However, something stood out to me when looking at the latest report so I went back and cut-and-pasted the age and sex graphs from the past few consecutive weeks to make VDU Figure 3. Sure enough, there was a particular spike in the 5-9 and 10-19 year old age bands (yellow arrows in graph boxed in red). Even allowing for changed y-axis scale in the first 4 graphs (dates are listed in each graph's legend) these 2 bands seem to have risen just in the past reporting week. 

Still, the overall pattern of rising case numbers, a dip in the 20-29 year old age band, then a rise before a consistent drop off is retained. Is this the result of school kids returning from school holidays on the 23rd of July, sharing their viruses, incubating an infection and becoming ill? If so - will we see a rise in parent - age age bands in the report after next's? Let's watch and see!

VDU Figure 3. Figure 4s from previous weeks of State of Queensland (Queensland Health) report found here.[4]
Images excised from PDFs and pasted together using 

Adobe Photoshop CC 2015.0.0
Click on image to enlarge
References....

Wednesday, 18 February 2015

Guangdong sees sense among the feathers...

Guangdong province in southern China is suspending its poultry markets. All of them. From 15-Feb to 28-Feb.[1] While the closures are only for 2-weeks, this will be very important for stopping human cases of avian influenza, particularity of the H7N9 subtype, during the bustling spring period in China. 

Live poultry market closures also remove a traditional dish of fresh cooked chicken. One can be certain that no-one will die because of the substitution of frozen or factory prepared chicken for a fresh chicken, even if chefs don't succumb to the tantrums of last year and refuse to prepare dishes made from anything but fresh market-selected poultry. One can be equally certain that if the markets remain operating during the peak season for influenza virus circulation as they have been, that human infections, and deaths, due to H7N9 infections, will also continue 


Guangdong province has been a major
source of human H7N9 cases in 2015.
Some restrictions were put in place back in December 2014 [2], but that did not stop human cases of infection or deaths.

Why does this closure in Guangdong matter? 

Guangdong province has been a major source of human H7N9 cases this year, as it was in 2014. If we look at the activity under the outbreak curves, we can see the brown line of Guangdong cases has been prominent in both years, only brought under control last year after the closure of the poultry markets...although their temporary closure may have been the reason for the long tail on Outbreak #2's epidemic curve compared to Outbreak #1. Will that tailing happen again in 2015 because Guangdong's markets are only being closed for a short period? Time will tell. 

Occurring at a similar time is the change in seasons. Seasonal change towards summer, makes the survival of influenza viruses in the environment more difficult. It's hard to tease out any one main cause of the precipitous case decline; the market closures or the seasons changing or both. Because most H7N9 human cases have exposure to poultry listed among their details when they are passed along and posted by the World Health Organization, live poultry markets clearly are one major factor for human acquisition of infection. There is literature that agrees.[3,4,5]


The activity under the epidemic curves for each of the three outbreaks. Guangdong province-acquired human cases are indicated by the brown line and features in 2014 and 2015.
Having these markets close is a great achievement for stopping these unnecessary and preventable infections and deaths die to H7N9. Its a big step, a sacrifice and its social change in action. But shutting them permanently would be better.

References...

  1. http://news.xinhuanet.com/english/china/2014-02/15/c_126138118.htm
  2. http://www.thepoultrysite.com/poultrynews/33938/guangdong-restricts-poultry-markets-over-bird-flu-fears
  3. http://www.ncbi.nlm.nih.gov/pubmed/25340354
  4. http://wwwnc.cdc.gov/eid/article/20/12/14-0765_article
  5. http://jvi.asm.org/content/88/6/3423.long

Sunday, 2 November 2014

Influenza A(H7N9) virus: detection numbers and graphs...

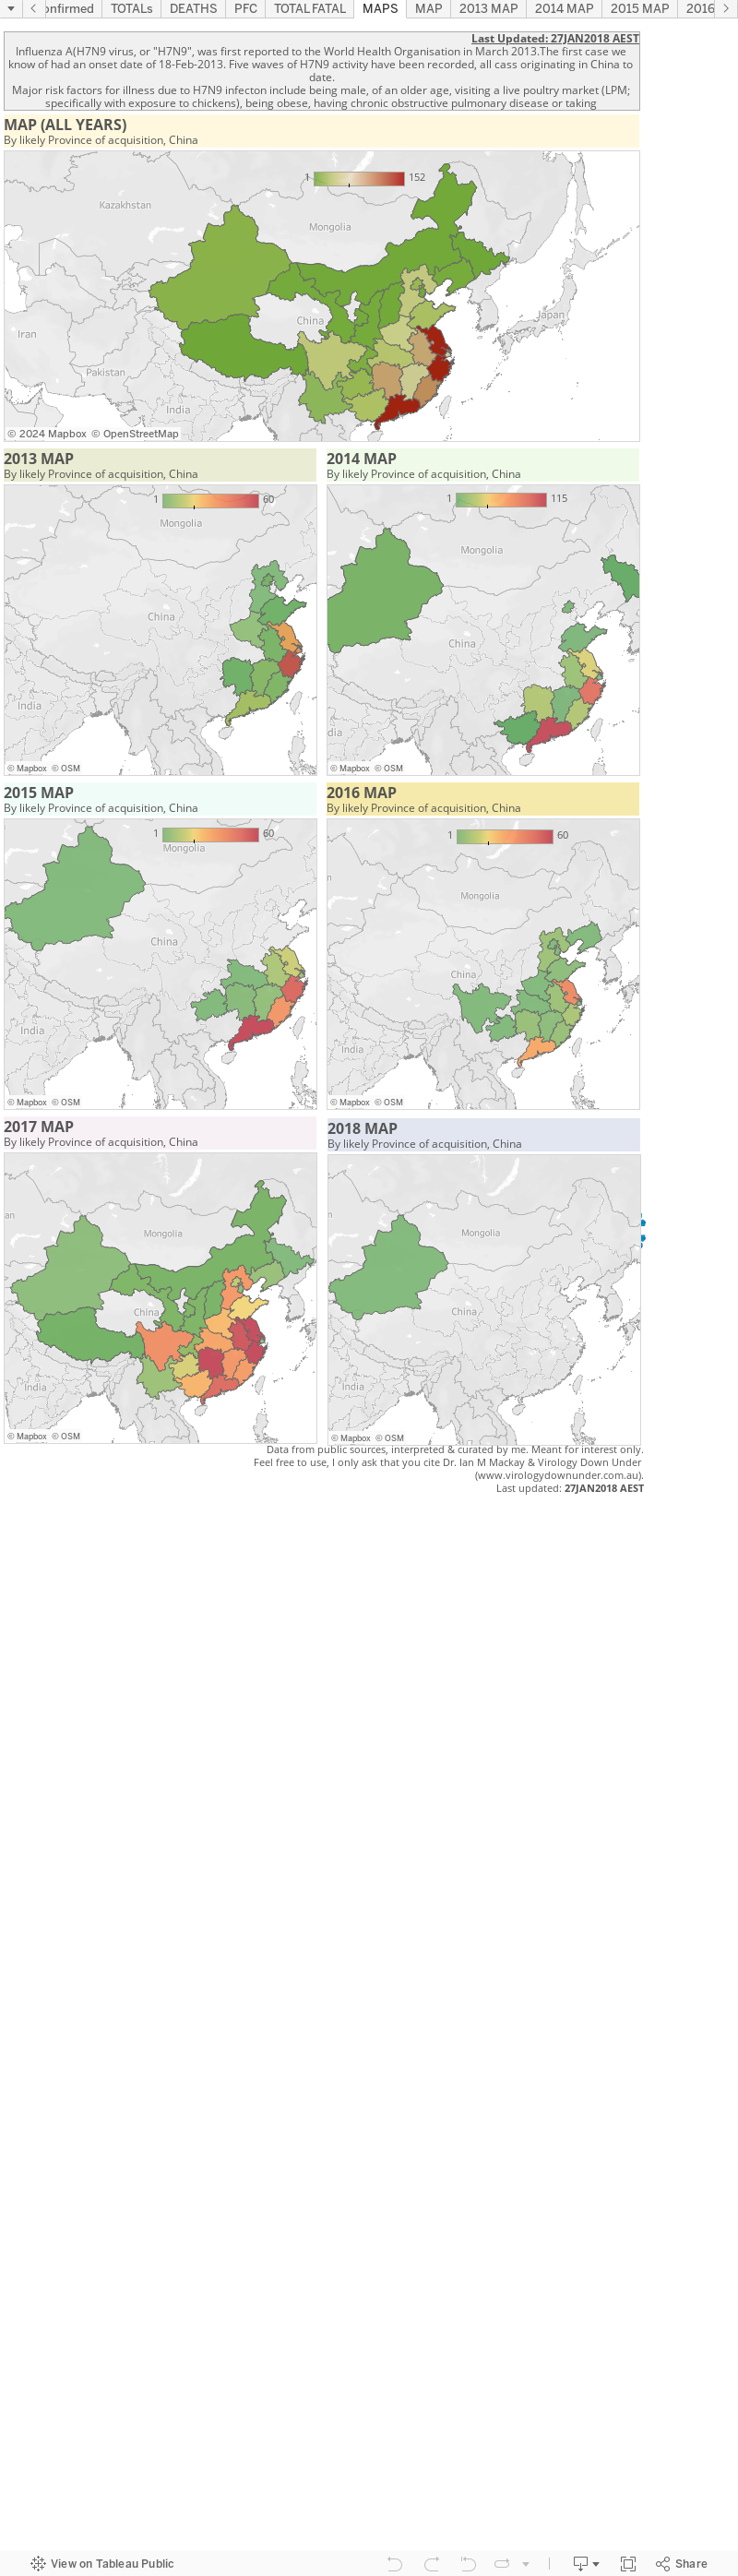
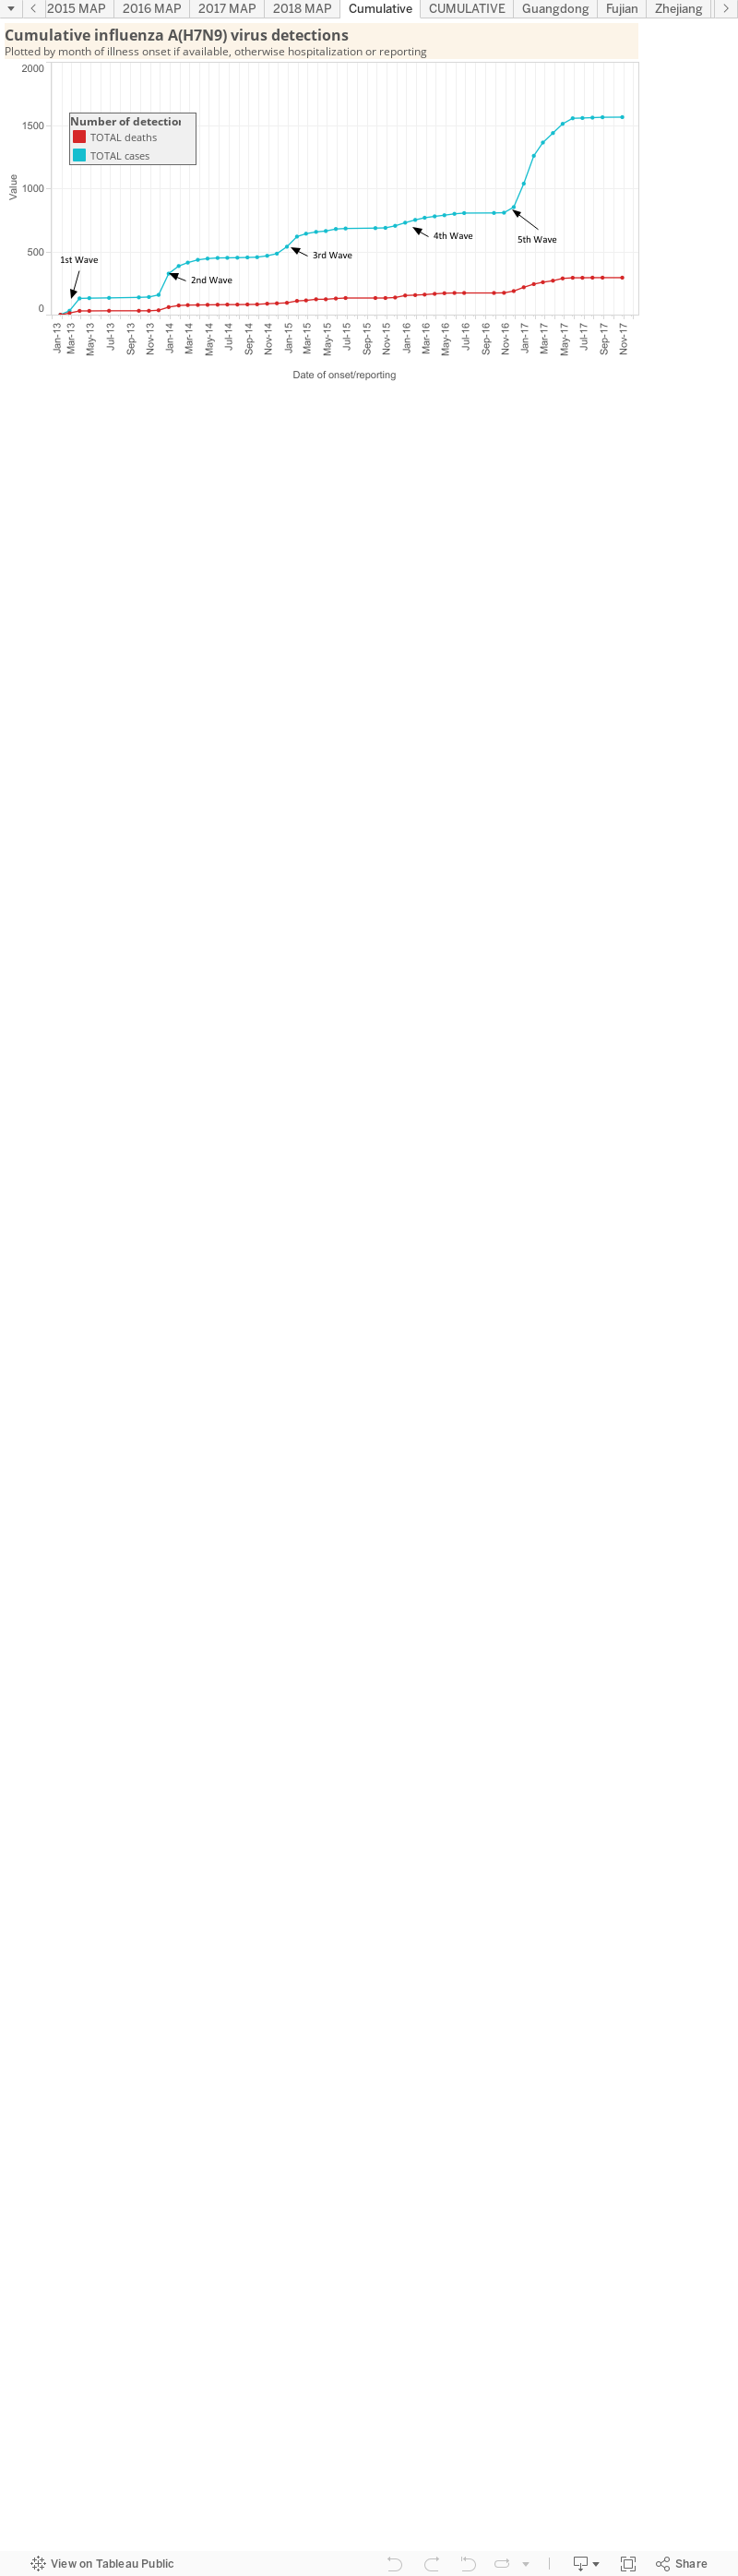
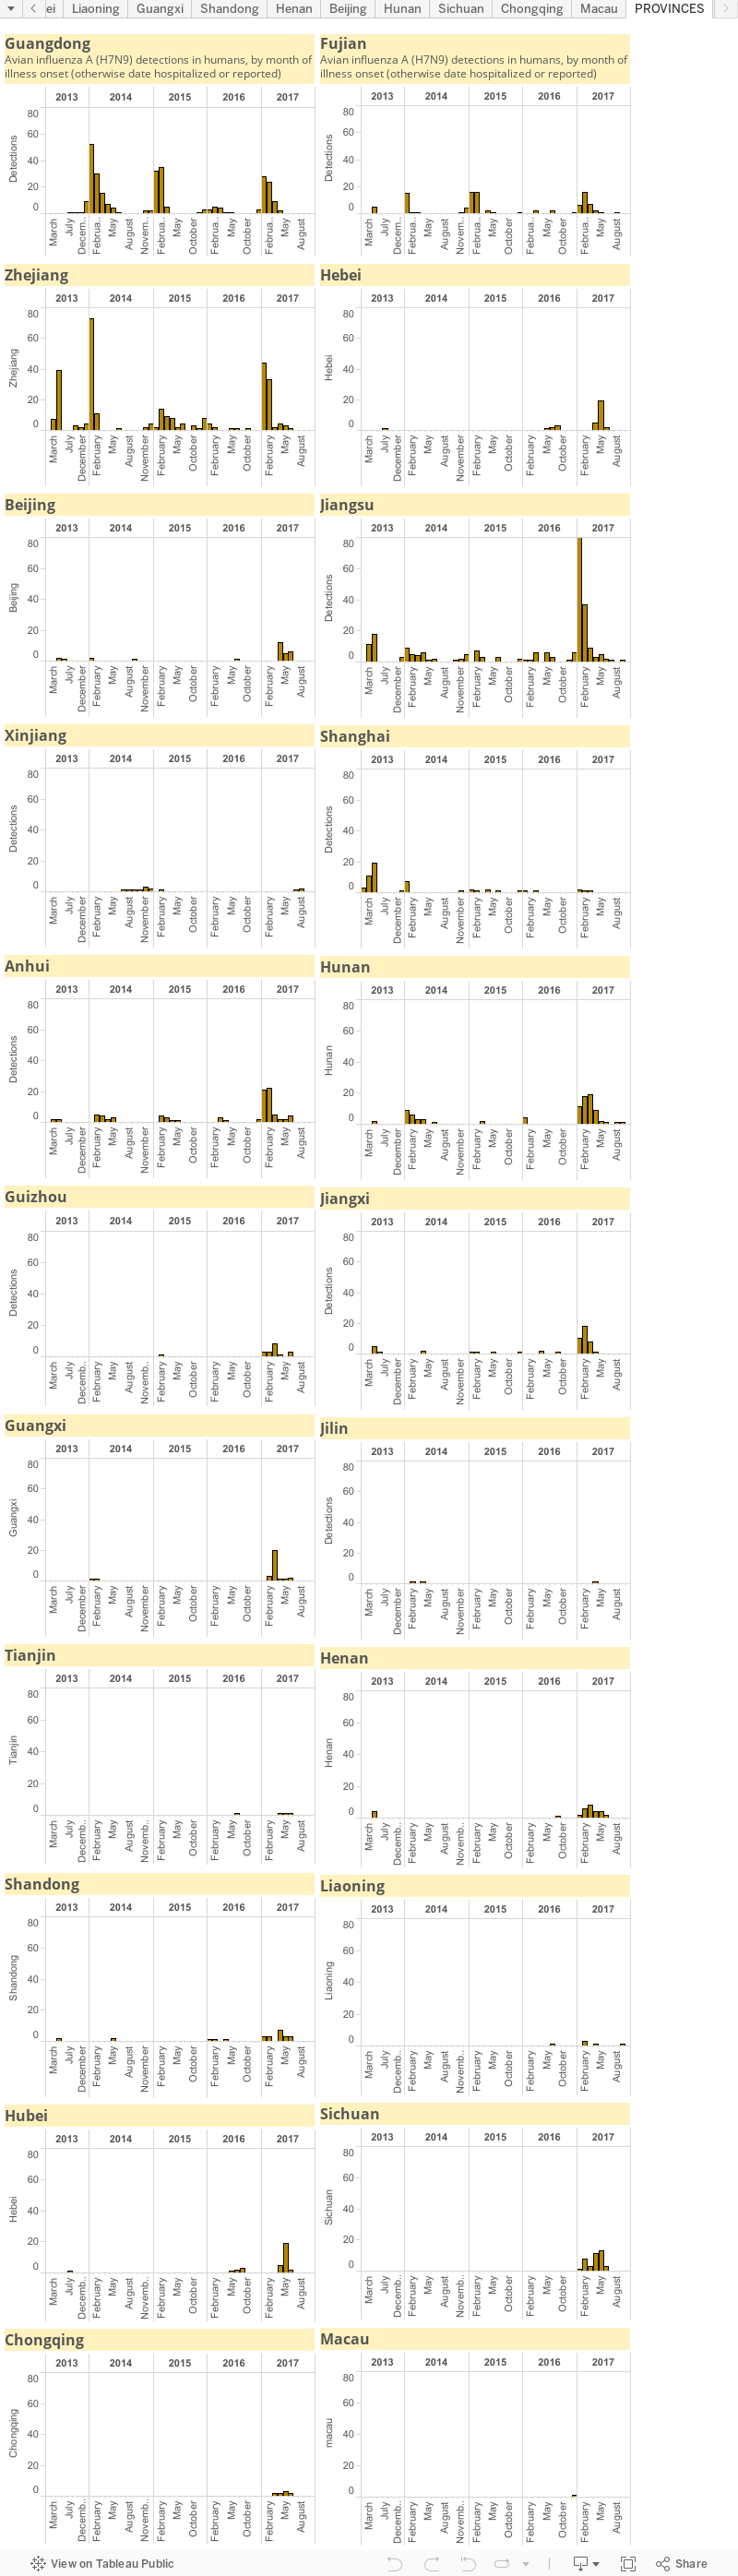
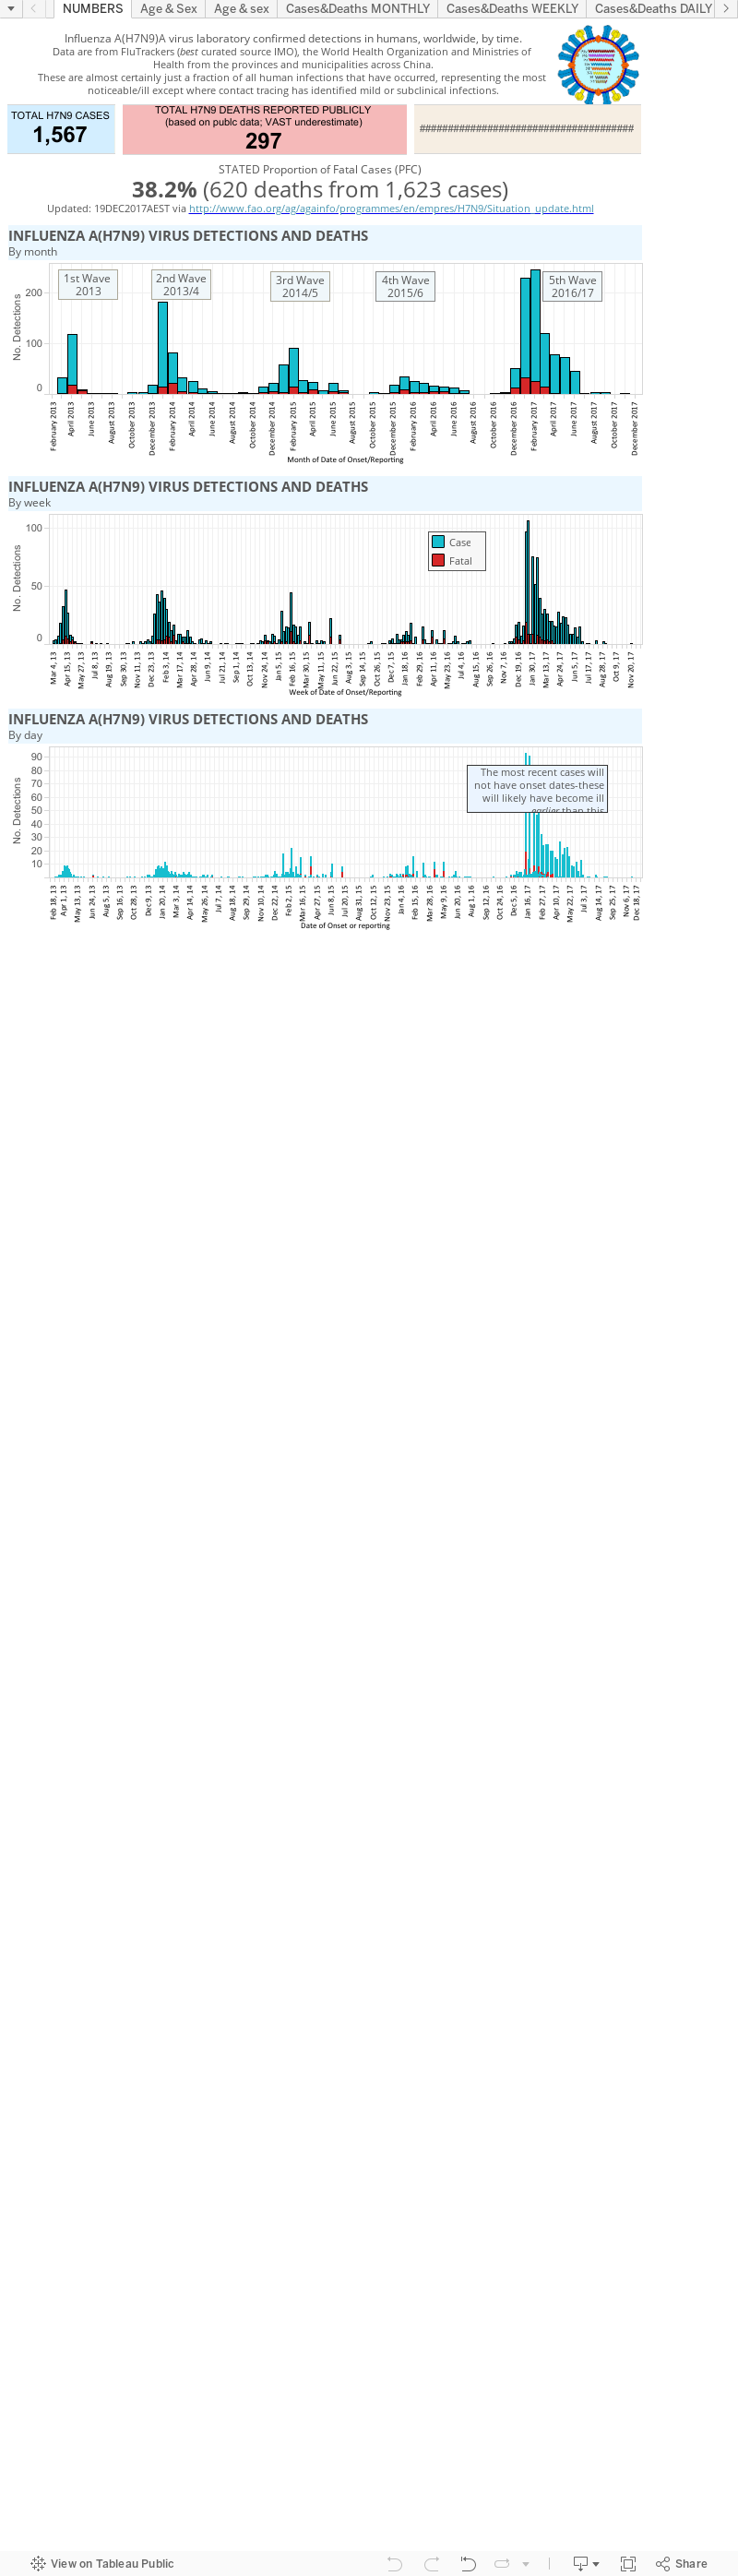
This is a static page that houses my graphs of influenza A(H7N9) virus ("H7N9") numbers produced by the various Ministries of Health for the provinces and municipalities of China, Hong Kong's Centre for Health Protection (CHP) the World Health Organization and FluTrackers.

Please be aware that these numbers are in flux during the winter epidemic. They are a guide only.

There is also an accompanying map page which for now is located here.


Reminders: 
  • The graphs above, as with all on VDU, are made for general interest only. They are also freely available for anyone's use, just cite the page and me please. The data can be downloaded by clicking on the "Download" link at the bottom-right of each dashboard. It may be that I have misinterpreted the language in the reports (sometimes a little tricky to wade through) or miscalculated some totals based on the way data have been presented.
  • In any outbreak, epidemic or pandemic caused by a know or emerging pathogen, the numbers presented publicly, and used in these graphs, are expected to represent only a fraction of all the cases that have and are occurring. This is just the nature of the imperfect biological'ness of these events.
  • I am only able to plot what is publicly available-you could do this too. No secret associations or back-room deals provide me with these data.

Thursday, 19 June 2014

Influenza in Queensland, Australia: 1-Jan (Week 1) to 8-June (Week 23)

Map of Queensland's Hospital and Health service 
areas. Adapted from
Click on image to enlarge.
Waaaay back on 18-March we looked at how influenza notifications in Queensland (population ~5mill) were above the 5-year-to-date (YTD) average. 

"Woopty Doo" some, perhaps very few, of you said. "That number means nothing until you look back at it later". 

So, let's look back at it now that it's later. 

It was Autumn then and now its Winter which is Flu season and also the season when we get some more public info on a handful of other  respiratory viruses circulating here in Queensland thanks to the collatory (I don't care if a dictionary doesn't recognize it) genius of the crew at the State of Queensland, Queensland Health (SoQ|QH).

So what's happening with flu Down Under? For all the detailed detail, I recommend you check out the Open Access document, Statewide Weekly Influenza Surveillance Report that spans up to Week-23 (that's the week ending 8-June; we're in Week 25 now)

Turns out its still 2x (well,  1.987x but who;/s counting?) above the 5-year-to-date mean. No, this is not a "I told you so" - just that it's interesting to see that on this occasion at least, autumn trends predicted a winter event. Still, its only early winter. We've also had a very warm and dry autumn (see the Bureau of Meteorology for more on Autumn) for those who like to link weather and influenza activity.

I like to look at virus interactions as driving their own seasons. How is that possible I eerily hear you ask (I'm not listening to the "Oh what a load of..." comments by  the way, so sit back down and put up your hand)? Well, they don't do anything themselves of course, but my theory goes like this...

When there are enough of us in the community infected by one virus (say respiratory syncytial virus [RSV]) and our immune-thing-a-me-whats-it is all fired up and producing an inflammatory response to rid us off said pestilence, that responsey thing offers a kind of "Shield's Up" effect. 

For a short while we feel like rubbish but we also don't let other viruses get in as easily because we're in an "antiviral state". Enough of us in that state and we get a kind of short-term herd immunity (a fairy died) - where the number of people fully susceptible to another virus (say, an influenza virus) is too small for it to get a good toehold in us and the population. This pattern among seasonal respiratory viruses is most often observed, in my experience, for viruses with an RNA genome like RSV, rhinoviruses and influenza viruses. 

Thankfully for my hypothesis, the data from SoQ|QH show a nice example of this pattern of viruses interacting with viruses within us, projected to the level of the community. 

A snippet from the State of Queensland, Queensland 
Report  for 1-January-2014 to 8-June-2014.
Edited by Ian M Mackay, VDU.
Click to enlarge. 
Let's have a look at the adjacent figure I've mixed around from reference [1]. Hopefully I haven't broken any copyright laws in hacking pasting as I have.

Part A shows the notifications for influenza viruses in Queensland. Peaks and troughs, As and Bs. Cool

Part B shows some of the respiratory viruses, including RSV which has been having a bonza season this past autumn by the looks of things.

Can you see the pattern?

Part C is a cobbled together composite I made in Photoshop/Illustrator by laying B over A and making B partly transparent. It's a bit rough and has had the axis labels and legend trimmed off for clarity, but it makes the point. What it shows (to me anyway) is that when RSV numbers go up, influenza virus notifications head downwards. 

Is this due to RSV influencing influenza or influenza exerting its muscle on RSV? Can't tell from this sort of analysis. 

The fact that RSV can rise in the presence of influenza virus may speak to its dominance. But take a step back. Remember we're taking about people not cells in a dish. It may be that 2 distinct populations are at play initially; perhaps younger children with RSV versus older children and adults with influenza. Once infected people reach a critical mass, that virus may win out and "push put" the other.What's happening in a single household - kids bringing home one virus, parents another perhaps? That would be intriguing to know with these concepts in mind using molecular methods and longitudinal regular sampling of whole families, regardless of symptoms.

Statistically, when I've looked at this with other data, that negative association, more obvious and frequent between influenza virus and rhinoviruses, does reach significance. You can read one of my group's hospital-based studies in [4] and a collaborative community study in [5]. Rhinovirus seasons usually bracket influenza season. So I offer a different view of how seasonal viruses are seasonal. With the sources of variability I discuss above as well as genetics and differences in everyone's past virus exposures and immune-thing-a-me-whats-it status to each virus, some cross-protective, some not, some having got really sick last year, some not...its not hard to see how those virus seasons can shift around from year to year as well.

Yet another reason to test for viruses, and to include more than just 1 or 2 viruses in that testing; the more you test, the more you can observe and learn.

By the way, interferon-the major player in causing these virus:virus interactions, got its name because it could block a secondary viral infection much like those that I've described above, but on a population level.

Now, try and get some funding to do any research on that. I hate you if you do by the way (yes, I failed miserably).

References...

  1. Statewide Weekly Influenza Surveillance Report, 1-January to 8-June 2014.
    http://www.health.qld.gov.au/ph/documents/cdb/influenza-qld-140101-140608.pdf
  2. Queensland in autumn 2014: A warm autumn; coastal rainfall but dry inland of the Great Dividing Range
    http://www.bom.gov.au/climate/current/season/qld/summary.shtml
  3. Do rhinoviruses reduce the probability of viral co-detection during acute respiratory tract infections.
    http://www.ncbi.nlm.nih.gov/pubmed/19376742
  4. Community-wide, contemporaneous circulation of a broad spectrum of human rhinoviruses in healthy Australian preschool-aged children during a 12-month period.
    http://www.ncbi.nlm.nih.gov/pubmed/22829638

Saturday, 15 March 2014

H7N9: the dotted lines that make sense of things...[CORRECTED]

Click on image to enlarge.
The latest H7N9 case-per-day chart shows that the trickle of human cases of confirmed avian influenza A(H7N9) virus infection is becoming a drip. The tap? My money is still mostly with the market closures. What precisely in the markets is the source of human H7N9 acquisition? Dunno, but the consensus seems to be poultry; songbirds also look pretty good though. It doesn't have to be, and is unlikely to be, just 1 thing of course. We know that this virus, as with other avian influenza viruses, can be shared around among bird species. It can even go into a human and that isolate be used to infect a bird again. See my recent post on some of this.


Click on image to enlarge.
What's also particularly intriguing, among the many interesting aspects of H7N9's acquisition and spread among humans, is that we're seeing much more "shouldering" in the Wave 2 epidemic curve than we did in Wave 1's.

Instead of the precipitous decline we saw back in 2013, we're seeing a drop down to ~10 cases per day, but then a slower decline the rest of the way. Is this because we started human cases from more sites this time around?; because markets took longer to close after the cases numbers began to climb?; is it related to markets being closed at different times, in different ways, in different locales? Who knows?
Cases by region acquired, per week, with different
 regions highlighted by coloured lines and the 
total case number in the background (grey).
Wave 1 and Wave 2.
Click on image to enlarge.

Dr Katherine Arden suggested I have a look at what's happening in each Province or Municipality and see whether any particular place can shoulder the blame for the shouldering. And that does seem to be the case if you look at the adjacent chart. Guangdong province seems to be the major culprit contributing to the shoulder effect. 


Cases by region acquired, per week, with different
 regions highlighted by coloured lines and the
total case number in the background (grey).
Wave 2 only.
Click on image to enlarge.
In the zoomed-in version that focusses on Wave 2 alone, we can see that the Wave 2 "peak" has in fact 2 peaks; the 1st peak dominated by Zhejiang province cases and the 2nd driven by a surge in Guangdong provincial cases. Guangdong cases took longer to drop away, and are in fact still being reported, possibly because the major poultry markets there were closed later than in Shanghai and Zhejiang province and only temporarily for a clean. Or perhaps the bird outbreak @influenza_bio and I discussed has a source in Guangdong province?

It's all speculation beyond the data we can actually plot.

Friday, 14 March 2014

Google Flu Trends: not so perfectly predictive?

I'm no expert at the algorithms that go into the search giant's Google Flu Trends (GFT) predictive website so take what follows as a very superficial opinion. It does not surprise me at all that a recent paper in Science [1], backing up previous chatter on this subject [2], finds GFT is is not very accurate. Specifically, it has been overestimating peak influenza levels compared to more traditional laboratory-confirmed cases (itself only a subset of all cases) and influenza-like illness presentations to Doctors (a non-specific method of trying to identify influenza from a swarm of other ILI-capable viruses). 

A note: this recent paper is more a look at big data and whether it deserves our complete trust yet (it doesn't, is the message) than it is an analysis of how best to predict influenza virus activity in the future.

It would be fantastic if we could have a predictive system that could work around the need for actual testing of sampled people and give us an informed guess as to what flu was doing, how long it would be doing it, how severely it would do it and when it might start and stop doing it...I just don't have a lot of faith in predictive things like this. Perhaps I've just entered into a grumpy middle-aged male phase of my life....but I think that if we want to find out what's happening, we don't need to look too much beyond simply (not so simple when it comes to lab capacity and funding of course) upping the level of testing and typing that we do.

Even now, the current situation in Queensland of a 2-fold increase in influenza virus notifications compared to the mean of the past 5-years does not really show up so clearely on GFT.


Given that so many variables will contribute to a person's choice to search for "flu" (or whatever related text GFT includes in its algorithms), it makes perfect sense that a website showing flu activity in your area that is based on that component of the results, will be an over-estimate, especially during the peak times of flu activity. Why then? Imagine the impact on search when the media is most active in trying to get your pageviews using headline banners with "killer flu" or "early flu season" in them. People don't just chat over the back fence in response to those headlines any more, they go looking to the internet to provide their answers, news and sometimes poorly communicated facts. This will not just indicate that the have the flu, it will reflect concern that they may get it at some point in the future.

GFT also taps "real" flu data from real testing labs and Doctors clinics. This means its performance is probably not "off the rails" wrong, just overly influenced by non-infectious factors at peak times.

Are the inflated results positively affecting flu vaccine uptake I wonder? That would be a good thing. Might even have an impact on the size of the peak season.

Of course, no one knows what the actual numbers of flu cases in the community are; because flu is not always a serious disease that leads us to get a sampled collected and tested. The serious disease gets to a hospital and does get tested. these get added to notifications. Sure, influenza virus can cause a more serious outcome than many other respiratory virus infections, especially in certain groups, including death on occasion. There are also many mild infections that fly "under the radar". Those numbers won't be accounted for anywhere except through modelling. Perhaps the overestimate isn't that much of an overestimate; very hard to actually know that.

It's that damn iceberg tip again. 

References...

  1. http://www.sciencemag.org/content/343/6176/1203.summary?rss=1
  2. http://www.nature.com/news/when-google-got-flu-wrong-1.12413

Tuesday, 28 January 2014

Freeze those chickens....

As 8 new H7N9 cases are announced today we see a very welcome comment from Hangzhou City's mayor, Zhang Hongming...
"Hangzhou is planning to close live poultry trading markets permanently and promote the supply chains of frozen poultry products instead"
If Zhejiang Province can carry this off, it would be perhaps the single biggest intervention and risk mitigation step possible. 

Centralising poultry slaughter and providing chickens in a partially prepared and refrigerated/frozen condition could buy the time needed for research to catch up with public health needs. This could include further enhancing farm, market and human screening and finding the feathered or furry fiend(s) acting as the source(s) for these putative zoonotic transmissions (also for H5N1, H7N7, H9N2, H10N8, etc). 

Such change would also radically reduce the chance of selecting more efficiently transmitting human-adapted flu viruses by simply reducing contact between the large numbers of birds (and other animals) and humans occurring on a daily basis in the market environments and through the transport and slaughter of live birds throughout their heavily populated surrounds.

The changes in social behaviour and habits required the Chinese are huge, but such change should be considered as being as great an investment in the future health of the local and global populace as vaccines have proven to be.

Source...

  1. Xinhua
    http://news.xinhuanet.com/english/china/2014-01/27/c_126071190.htm

Monday, 27 January 2014

Zhejiang: more live bird market closures...

FluTrackers have posted a report originating from the Ningbo evening news in China stating that more markets in Zhejiang province, in the regions below, have been closed for cleaning and disinfection in an attempt to bring the Province's H7N9 outbreak under control...

These regions have already suspended trading...
  • Hangzhou city (which I noted here)
  • Xiaoshan District
  • Yuhang District
  • Jinhua
  • Shaoxing City
This new report notes closure of the following markets in the "main city of Ningbo" from 26-Jan..
  • Haishu District
  • Jiangdong District
  • Jiangbei District
  • Yinzhou District
Exotic bird imports and pigeon flying has been banned.

H7N9 Welcome to Week #50....

Media preview
Chart of weekly cases from @influenza_bio

Let's play duelling charts!! My colleague on Twitter, @influenza_bio, (whom you should follow if you are not already - he's got a knack for (a) getting across some nice flu-facts in a easy-to-understand way and (b) he rants - who doesn't like a ranter!?! That sounded less weird in my head.

Today's chart update from me shows the avian influenza A(H7N9) virus weekly and accumulation case chart. In case I haven't mentioned this lately, the human cases of infection by this newly emerged (in humans) virus is all from south eastern China. 

Given that cases keep on coming, this chart has changed a lot in a few days. The last chart is now already 4-days old. Ancient. See it here.


Click on image to enlarge.
My latest chart lists 246 cases and is based on the FluTrackers curated list (to be found, and checked regularly, here) and includes all recent WHO update information which provides some extra details - including date of onset of illness and hospitalization since late October. WHO has a few cases to catch up on.

These are useful additions since cases can be noted in the media or by the relevant ministries or public health institutions many days after the illness manifested in the patient and even after they were admitted to a hospital, usually in pretty poor medical condition. 1 more was added form Jiangsu last night that missed those charts.

I've arbitrarily listed the 2 "Waves" of H7N9 cases - if there is an official designation for dates, I'd be happy to hear of it.

Sunday, 26 January 2014

The return of the H7N9 case chart timeline...

Click on image to enlarge.
Please note, this chart is based on publicly available data and its completeness
suffers accordingly. It is provided as a guide only. Each black line (y-axis;
FluTracker's case numbering is used for comparability) represents a single, laboratory-confirmed
H7N9 patients' journey through time (the bottom, x-axis).  Data on patient discharge dates were
particular patchy in 2013 and I have yet to update what is available onto this chart (please ignore the terminal coloured dots for now)

...and its associated headaches.

This is a chart the really relies on complete data to be of full use.

I just had a look at the 2013 chart...you can find it here... which was last updated 02.06.2013. It's clear from that figure that detail on when H7N9 cases leave hospital was pretty scarce at the end of the first outbreak; or I couldn't find it. There has been a tally described in the past - around 86 cases discharged I think - but which cases is largely unclear.

So you can see that a lot of the 2013 patient's timelines trail off into infinity. By now those ill people would have been discharged or are part of the fatal cases list. Interesting that that link above describes a case that was hospitalized for 67-days, before succumbing.

Today I began the next case timeline chart for 2014. It's still a work in progress as I have yet to trawl through the cases to see which have been described as discharged (some definitely have) and I have not yet included those cases who were not admitted because illness was mild or without any obvious signs of disease at all.

As you can see from the new chart of 82 cases with a date of illness onset of 01-Jan-2014 or later (you'll need to click on it to appreciate the detail), the number of fatal cases, to date, is much lower tan it was in 2013's first wave of H7N9 infections.

It would not be surprising to find that most cases remain hospitalized in 2014 as the majority have been initially described as critical, severe or serious in this second round. I wonder how the contacts of these case are faring?

I will try to flesh this out in the coming weeks. Hopefully we remain as red dot-free as we are now.

Friday, 24 January 2014

Influenza in Queensland, Australia...

Image adapted from Geoscience Australia,
The Australian Government.
http://www-a.ga.gov.au/web_temp/1531782/61756.pdf
Hot, humid and sunny are the conditions here just now. Although some rain around too-stormy rain with big dumps of water an flash flooding. Must be summer.

In the previous week's Queensland Health Statewide Communicable Disease Surveillance Report it looks as though we have a slight uptick in laboratory confirmed influenza cases so far this year (this is in total numbers, not proportions of samples tested, so take the value with a grain of NaCl) compared to the year-to-date totals for 2013 and 2012 in Queensland Australia.


As of the the 13-Jan update (data from 12.1.2014)


  • 106 case notifications in 2014
  • 73 cases by this time in 2013
  • 41 cases by this time in 2012
  • 144 cases by this time in 2011
  • 21 cases by this time in 2010
  • 12 cases by this time in 2009

Pre-existing antibody reactive to avian influenza A(H7N9) virus did not predict better survival

Freeman and Cowling comment in the Journal of Infectious Diseases on a paper last year by Yang and colleagues (I made a note about that one here). They also re-analysed one of the conclusion and found that, for this dataset at least, having H7N9 antibodies did not afford a reduced risk of death. 

Freeman and Cowling conclude that this doesn't negate using convalescent sera (the bit of blood, minus the cells and the clotting factors, that contain proteins, water and the antibodies we make against an infection we've had) as a treatment option. But from the data in Yang's paper, the pre-infection existence of higher levels of antibodies that react with H7N9, did not improve chances for survival. 

More study is needed.

Thursday, 23 January 2014

Market sampling: H7N9, sensitive testing, market closures and small numbers

A World Health Organization Western Pacific Region update on influenza A (H7N9) virus has a few interesting bits of information that pulls together a recent flurry of reports. This is the situation as of 22-Jan...
  • 18/200 (9.0%) "pathological samples" from markets (listed below) in Zhejiang province, presumably using PCR-based methods, were H7N9 positive  
    • Sanliting Agriculture Products Market (6 oral/cloacal swabs, 2 environmental faecal swabs)
    • Central Agriculture Products Market (2 oral/cloacal swabs, 1 environmental faecal swab) 
    • Fenghuangshan Agriculture Products Market (1 oral/cloacal swab)
    • Guoqing Poultry Wholesale Market (3 oral/cloacal swabs, 3 environmental faecal swabs).
  • 2/2,521 (0.08%) pathological samples were H7N9 positive in Guangdong province
  • Pathology specimens from the provinces of Jiangxi, Liaoning, Jilin, Heilongjiang, Jiangsu, Fujian, Shandong, Hubei, Hunan, Guangxi, Yunnan, Qinghai, Xinjiang Provinces and Chongqing and Shanghai Cities were H7N9-negative
  • 7-Jan, H7N9 RNA was also reported  in 3/17 samples collected from the kitchen of a restaurant in Haizhu District, Guangzhou City, from the chopping board and sewage water. 
  •  Meanwhile H7N9 RNA was identified in 8 out of 34 environmental monitoring samples collected from the Guangdong's Longbei Market, Jinping District, Shantou City.
  • Ningbo city (Zhejiang Province) has stopped commercial live birds entering the city
  • Shanghai city will suspend live bird trade all over the city from 31-Jan to 30-Apr. Live poultry from other provinces will not be allowed into the city except for transport to a centralized slaughterhouse.
It's great to see some data from other provinces and municipalities that have not reported any human H7N9 cases to date.  I do wonder about the relatively small numbers of market samples though. Some of these samples pale in comparison to what was tested in 2013; which reacted earlier than this, the second time around. While 2,00 samples is not an easy day in the lab, we saw >800,000 bird samples tested by "virological" (?culture) and serological methods in 2013 (see other thoughts on the use of PCR in birds here).

So what have we learned here? 
  1. Further confirmation that live bird markets house H7N9-positive birds. With most human cases this year having come into contact with poultry, the transmission chain is in place. Market closures seem the most effective way to stop transmission abruptly and they have a precedent for this in 2013. This is happening. Will it be enough? What  about the market-supplying farms?
  2. RT-PCR testing is more likely to uncover influenza in birds than culture methods and is better than antibody testing (although how much better is hard to judge from the information provided). Added bonus: RT-PCR is more likely to tell you what's circulating now rather than a little while ago...although no-one really responds to the lab results that quickly anyway.

H7N9 snapdate: cases per week and cumulative cases

Click on image to enlarge.
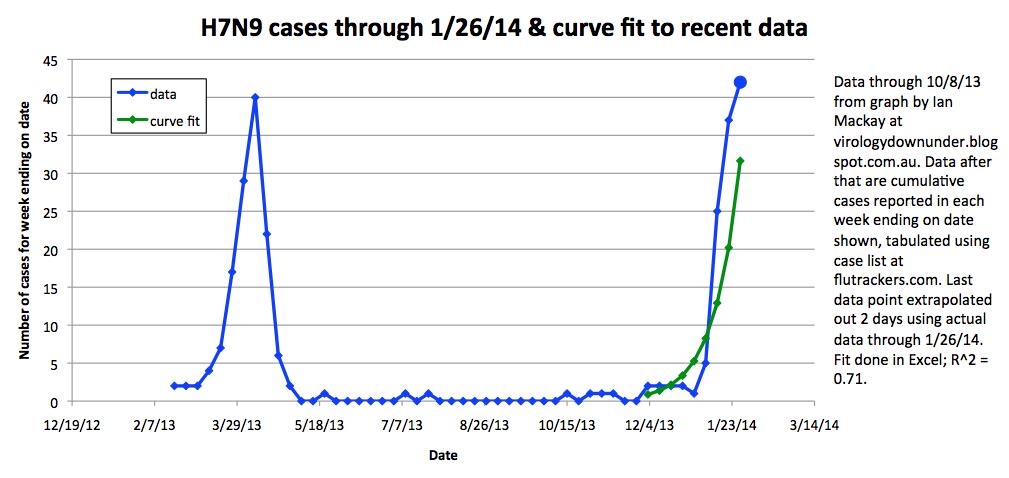
This "snap update" is about the H7N9 epidemic curve. It reveals that the second wave of H7N9 human cases are really piling up this winter. As I sit here at 9:30pm (7:30pm in Shenzen), I've just added another 7 from Zhejiang (n=5), Shanghai (n=1) and Guangdong province (n=1) for today. 

It's also worth noting that we did not know of H7N9 in humans this time last year; we are still a few weeks away from the 1st anniversary of H7N9's discovery. WHO was notified 31-March-2013, but onset of first illness due to H7N9 was 18-Feb-2013). Its case numbers suggest a slow rise compared to a seasonal human influenza epidemic (H1N1 or H3N2 viruses for example), but it is a rapid rate for an avian flu in humans.

Tallies have hit 25, 26, 7 and 12 cases (=70 so far) per week for the past 4-weeks (beginning 30-Dec, 6-Jan, 13-Jan and 20-Jan respectively). These tallies will change if/as new case announcements continue and are assigned to dates of onset that sit in among these weeks.

Zhejiang province: then and now in H7N9 town

Click on image to enlarge.
The data are plotted as number of cases (y-axis)
vs. week of illness onset (or date reported if
onset data was not reported). The time span is
the same for both graphs (2-months) and the
number of cases is fixed at a 50-cases on
the y-axis of both so that the slopes can be
compared.
A quick look at what life was like in Zhejiang province, the current H7N9 hotzone, over a 2-month period (top) when cases really took off in 2013 compared to the past 2-month period this year.

The current slopes is less steep and the case tally is a little lower, but it is not hard to see that both will increase if the current rate of cases continues; of the last 18 H7N9 cases, 12 (67% or two-thirds) were from this province.