Showing posts with label influenza. Show all posts

Friday, 27 January 2017

H7N9 is having a big season...Happy New Year!

My how things can change in 5 weeks. 

If you look back a few posts you'll see that in late December, the data suggested avian influenza A(H7N9) virus was having a wimpy season - its slowest to date. 

Well, thanks to 100+ cases in China which have been bulk reported by the ever vigilant Hong Kong Centre for Heath Protection (CHP) - and captured and listed by FluTrackers - the situation has changed dramatically. 

Never take your eye off influenza virus - especially during its favourite season. And this season is a particularly active one for avian influenza all over the world.[4]

H7N9 is an avian influenza virus (hence the  "bird flu" moniker) that to date has been localised to China - especially but not exclusively to its eastern coast provinces - and it's a flu virus that doesn't make the birds it infects noticeably sick. 

These "low pathogenic" influenza viruses can sneak silently through poultry flocks because infections are mild - they don't cause infected birds to get sick or die. 

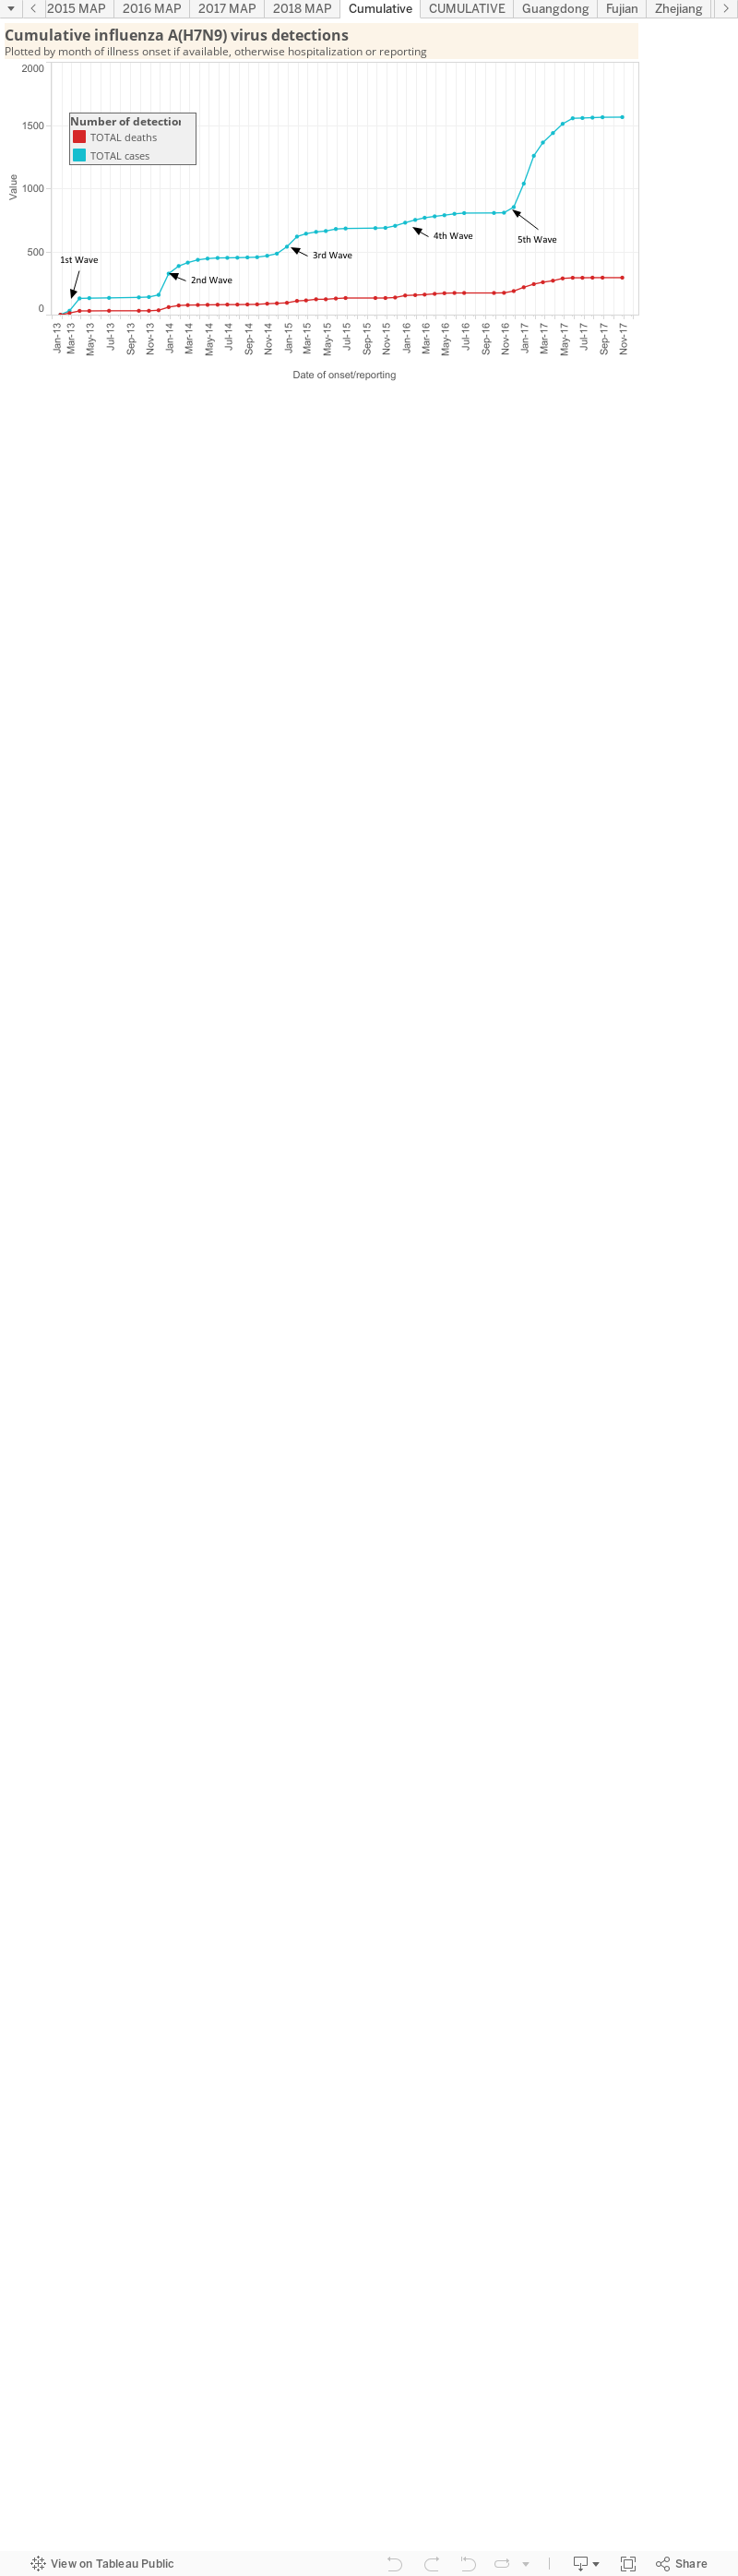
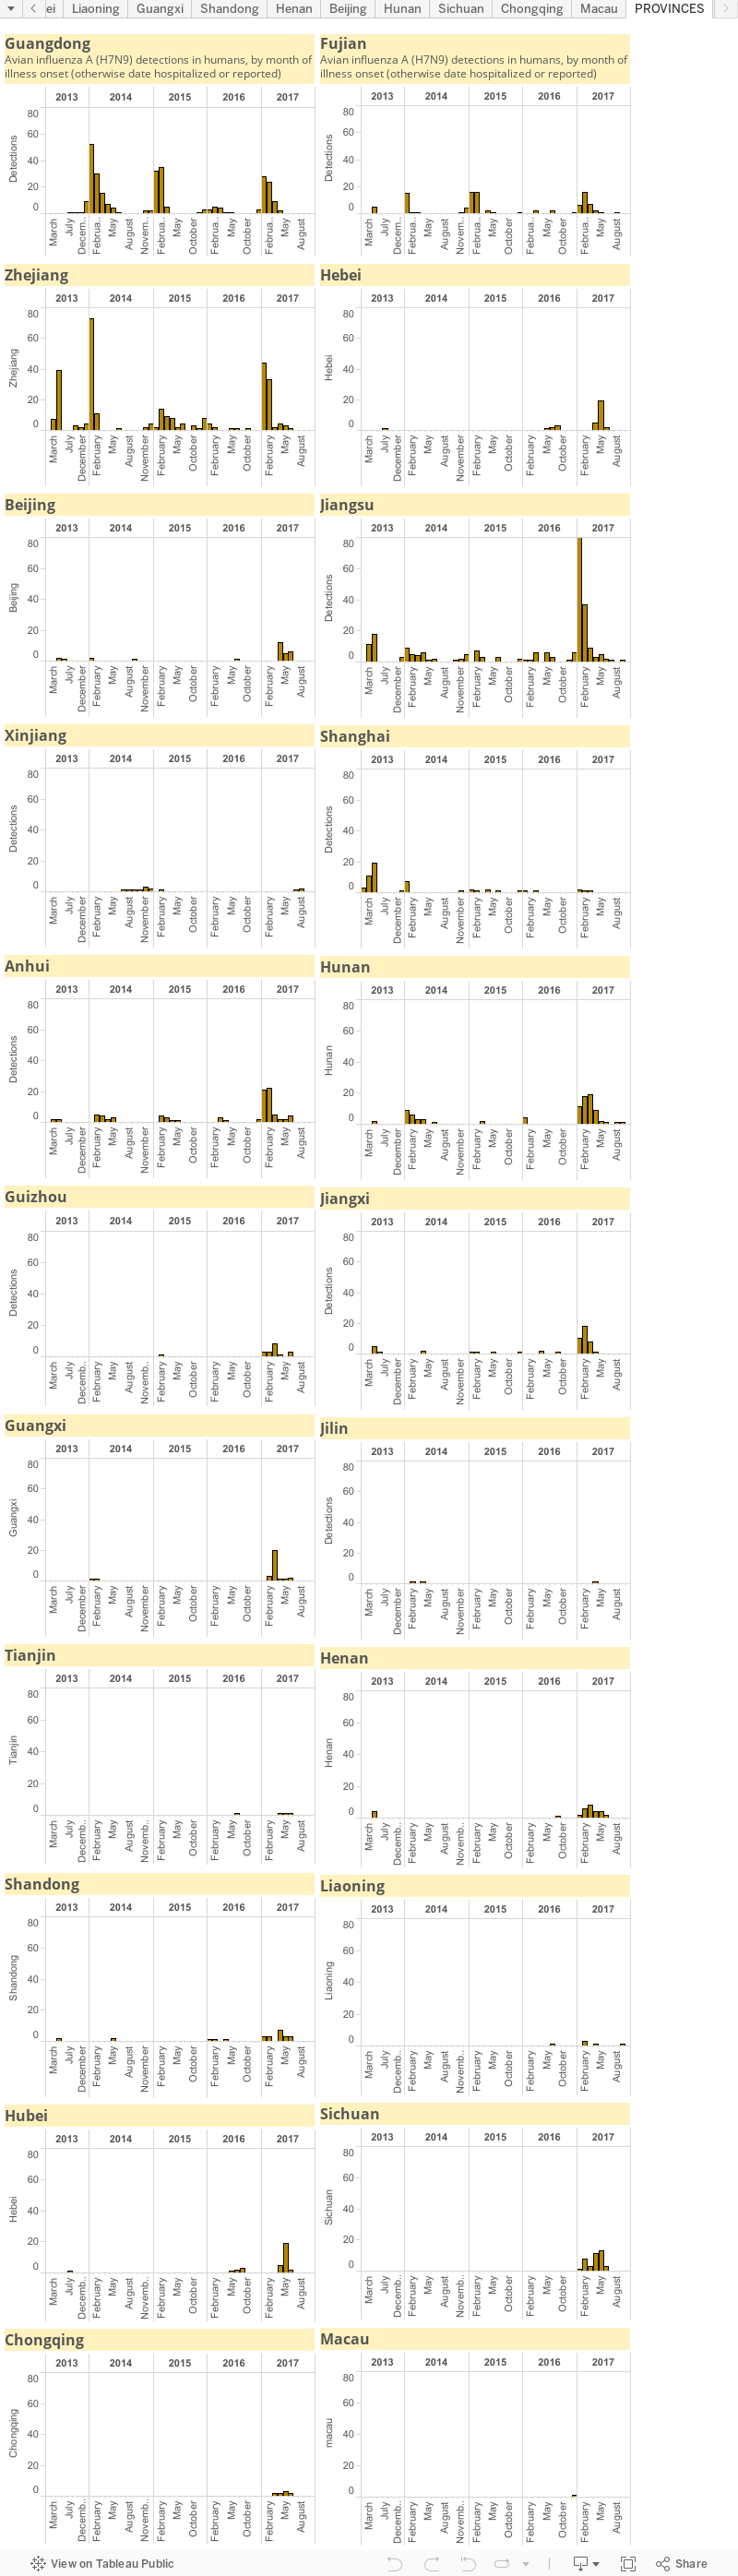
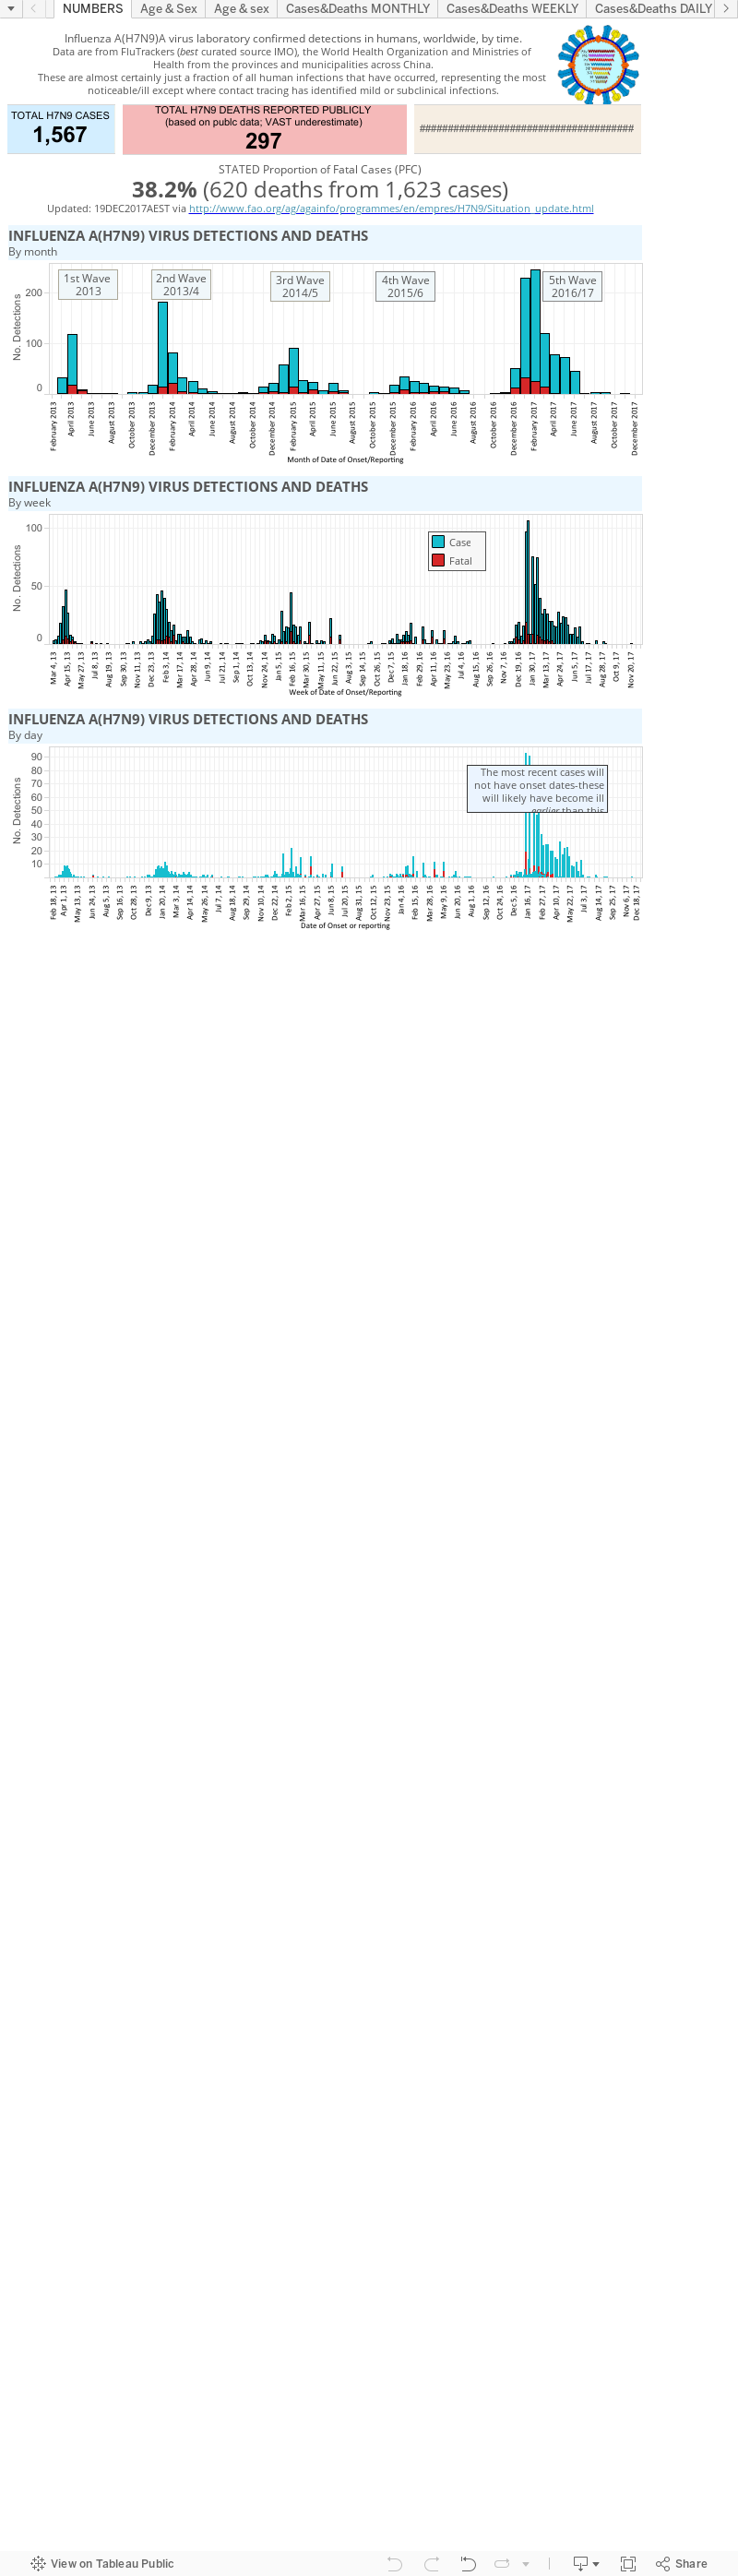
Data on human infections with avian influenza A(H7N9) virus. Data from [1]
Click on image to enlarge.
The H5 avian influenza viruses on the other hand - H5N1, H5N8, H5N5 or H5N6 for example - are called "high pathogenicity" avian influenza viruses because they kill off infected birds. Thankfully, H5N1 is the only H5 avian influenza that has caused a sizable number of human infections. H5N6 is gaining some ground though. The other H5s do not reportedly cause much impact in humans. Whether this is because they are not found or not sought in humans who have had contact with infected animals is unclear.

Disease in an H5-infected flock can serve as a sentinel for an outbreak of the virus. 

With H7N9 though, it's humans falling ill that set of the alarm that H7N9 (or another influenza virus) is in the house...or the market. And there are a sizable number of deaths among those - often male - who already have some sort of underlying illness and then acquire an H7N9 infection.

Most human cases of H7N9 result from contact with a "wet" market, also called a live bird market (LBM) in which chickens and ducks can be chosen, killed and dressed to provide a super-fresh meal. These tasty treats are especially in demand around this time of year as Chinese New Year is upon us. 


Chinese New Year is also a time when we observe the largest seasonal migration of humanity in the world. [2] Loved ones travel across a massive country to visit each other, share stories, traditions, meals - and the occasional respiratory virus like influenza. 

From [3].
In the coming weeks, as the gatherings disperse, it will be very interesting to see whether the current spike in human H7N9 infections is reflected by a steep rise in human cases acquired during the New Year celebrations - some of which include contact (direct or indirect) with infected poultry in backyard farms or LBMs.

Stay tuned. And don't forget to wash your hands often and cough/sneeze into the crook of your elbow.

References...

  1. http://virologydownunder.blogspot.com.au/2014/11/influenza-ah7n9-virus-detection-numbers.html
  2. https://www.nytimes.com/2017/01/26/world/asia/chinese-new-year-home-lunar.html?_r=0
  3. https://www.cdc.gov/flu/protect/covercough.htm
  4. http://news.trust.org/item/20170126150919-05z2c/

Friday, 23 December 2016

H7N9:2016 has been the most quiet year to date...

Influenza A(H7N9) virus, or 'H7N9', has had a quiet year when compared to past outbreaks.

All human cases to date have been linked to China. The majority of human cases have had some link with poultry - chickens or ducks - although we do hear of human-to-human transmission, this seems to be limited. H7N9 has been found in poultry from backyard farms and in live poultry markets (LPMs) in China - sometimes in the company of other influenza viruses, like H9N2.[1]

Cases and deaths each month over the 4 years we have known
about human cases of H7N9 infection.
Click on image to enlarge.

Despite the slow year,the 2016 graph above shows the usual December uptick in human cases. It will be what happens next that matters. Will be see a big January surge as in 2014, or a later Feb-April surge as in 2013 and 2015? Will live LPMs be quickly closed, disinfected, the animals destroyed and any outbreaks in 2017 squashed or will they remain open allowing more human cases as the virus spreads among market animals?

Time, and testing data - which China generates lots of but does not seem to enjoy publicly reporting - will tell.

In 2016 - 2 new regions were added for the first time - Tianjin municipality and Liaoning province - both in the north-eastern coastal region of China. 

In 2013, no sustained human-to-human transmission had been reported [2] - this remains true up until today.

References...

  1. https://www.ncbi.nlm.nih.gov/pmc/articles/PMC4911810/pdf/nihms749408.pdf
  2. http://www.nature.com/news/mapping-the-h7n9-avian-flu-outbreaks-1.12863

Wednesday, 24 February 2016

Line by line for H7N9...

My thanks go to the team at the World Health Organization for adding a downloadable line list for avian influenza A(H7N9) virus cases to their website.

This a great addition and will make following the seasonal outbreaks so much easier. 

I don't know when in 2016 it appeared, I just noticed a referral to it in the latest ProMED post and its seem that both go 2016's disease outbreak news posts (19-Jan and 10-Feb have attached lists. I had been bemoaning the lack of detail for a while so this really is fantastic.

There don't seem to be any lists from 2015. Should I push my luck further and ask if any of 2015's cases will be added to a list retrospectively?

Friday, 4 September 2015

To (type) B or not to (type) B...

Image adapted from Geoscience Australia,
The Australian Government.[13]
The latest weekly influenza statistics for Queensland were made public today.[1] Unfortunately there are no hard public numbers to support claims about the proportion of strains from the two influenza B lineages that affect humans that have been circulating in Queensland - for either July or August.
I was hoping to find some support for comments in the media this week which included...
The Brisbane strain has accounted for 27 per cent of influenza B cases in the year to August 23 [2]
  • This is in the latest report,[1] but these are year-to-date proportions -almost pointless for the spike in cases that happened more recently i.e. 48% of 2015 influenza cases occurred in the past 3 weeks [12]. Also not helpful when considering how few influenza Bs seem to be 'lineageanated' (have a lineage determined-further characterised - ?term)
..it was 25 per cent higher this year[3]
  • Talking about B/Brisbane strain's rise
Whatever. The upshot is that Australia has had a big influenza B virus-dominated winter in 2015. 

At least some proportion of those Bs have been due to strains of Influenza B virus Victoria-like lineage. That lineage was not included in the sponsored trivalent vaccine - namely the Brisbane strain (first characterised here in Brisbane back in 2008).[3,4,5,6] 

I had expected, based on the earlier Eurosurveillance article from our southern labs[9], that an influenza virus with an already decent presence that had not predominated in a number of years and which was not covered by the current vaccine would take off and cause a big season. But it seems like that hasn't happened. And yet we've had a huge influenza B season here in Queensland, and across Australia, nonetheless. 

Seems a strange mix to me but I'm no flu expert so perhaps this is all very normal for this Rubik's cube of a virus. Here's hoping for some literature on this down the track.

Despite the completely unavoidable mismatch event there remain a bunch of influenza A virus subtypes and the Phuket strain of the other influenza B virus lineage (Yamagata) that are indeed catered for by this season's trivalent vaccine. While the flu season may be taking a turn downwards,[1] you may want to consider a vaccination if you or your family hasn't had one yet-talk to your GP!

The newer (to us in Australia anyway), less common and not (yet?) sponsored quadrivalent vaccine caters for both influenza B virus lineages.

Figure from most recent State of Queensland (Queensland Health) report found here includes data up to 30th August 2015.[1]
Images excised from PDF and saved using Adobe Photoshop CC 2015.0.0
Click on image to enlarge
Oh, and those age bands I've discussed previously [10,11], are still the highest - school aged kids (5-19 years) got a lot of influenza B in 2015. Compare that to my earlier comparison - those age bands have really shot ahead.[11]


Figure from most recent State of Queensland (Queensland Health) report found here includes data up to 30th August 2015.[1]
Images excised from PDF and saved using Adobe Photoshop CC 2015.0.0
Click on image to enlarge
References...

  1. https://www.health.qld.gov.au/ph/documents/cdb/influenza-qld-150830.pdf
  2. http://www.couriermail.com.au/news/queensland/brisbane-flu-not-on-the-radar-but-try-telling-that-to-13000-victims/story-fnihsrf2-1227508437647
  3. https://www.health.qld.gov.au/news-alerts/news/150901-flu-brisbane-strain.asp
  4. http://www.brisbanetimes.com.au/queensland/queensland-flu-season-worst-on-record-20150901-gjc8ie.html
  5. http://www.abc.net.au/news/2015-09-01/vaccine-has-not-protected-people-from-the-brisbane-flu/6739996
  6. http://www.smh.com.au/national/health/surge-in-unusual-flu-cases-prompts-warning-from-doctor-20150814-giz6s4.html
  7. http://www.brisbanetimes.com.au/queensland/queensland-flu-season-worst-on-record-20150901-gjc8ie.html
  8. http://www.noosanews.com.au/news/surprise-flu-strain-not-part-of-this-years-vaccina/2759817/
  9. http://www.eurosurveillance.org/ViewArticle.aspx?ArticleId=21201
  10. http://virologydownunder.blogspot.com.au/2015/08/queensland-influenza-age-shift-still.html
  11. http://virologydownunder.blogspot.com.au/2015/08/queensland-influenza-sees-shift-in-age.html
  12. http://www.dailymercury.com.au/news/surprise-flu-strain-not-part-of-this-years-vaccina/2759817/

Tuesday, 11 August 2015

Queensland influenza age shift still shifted...

Figure from State of Queensland (Queensland Health) report found here includes data up to 9th August 2015.
Images excised from PDF and pasted together using Adobe
Photoshop CC 2015.0.0
Click on image to enlarge
Also interesting:

  • 3.3X more influenza type B viruses than influenza type A viruses in week to 9th August
  • a proportion of the influenza viruses were further genotyped
  • 44% of that proportion were influenza B viruses of the Victoria lineage which is not the lineage in the trivalent vaccine this year (it is in the quadrivalent vaccine though - see full report for detail) 
    • NOTE - the report is not clear on how many genotyped specimens this represents
  • As you can see in the figure below - the 'flu season is still very much underway in Brisbane
  • Brisbane is also experiencing its own little 'mass gathering' which started last Friday - the Brisbane Exhibition.
Appendix 1 from the State of
Queensland (Queensland Health) report found 
here, including data
up to 9th August 2015.
Click on image to enlarge

Thursday, 19 February 2015

Avian influenza H7N9 human infection emerged 2 years ago...

Seems like only 365 days ago I wrote about H7N9 being 1 year old.

Now - it's another year later.

While we have studied, written, read and learned much, much more about this emerging respiratory virus than we have about the Middle East respiratory syndrome coronavirus - even after its 3 years among us - we are still watching a new outbreak of human H7N9 cases spread across China. 

Each year more provinces are added to the list to report human infections - more infections likely go unnoticed, unrecorded and/or unreported. Gaps in the reporting is not unexpected and not unusual. 

Each outbreak with its accompanying economic damage, financial losses, human illness and death is because of the desire to maintain a tradition, namely the consumption of freshly extinguished poultry.

We're really good at getting ourselves into pickles. And we seem to be doomed to repeat the patterns, playing catchup and never getting in front of our new and emerging infectious diseases problems. And each time we seem amazed at what we learn, but really, we learn the same thing over, and over and over again. Eventually we'll run out of infectious threats I guess. 

Or they'll run out of hosts in which to incubate in and spread from.

Happy Lunar New Year.

Saturday, 3 January 2015

H7N9 outbreak #3 underway?

What better way to start 2015 than a snapdate!! For those who are new to them here on VDU, they were initiated here and defined here as snap updates - posts that don't have lots of detail and chat...although they almost always end up having lots of chat!

Figure 1. H7N9 cases by week of onset (or hospitalisation
or reporting dates of the preferred onset date was
not made public).
Click on image to enlarge.
This one is an update of the situation of one of the many avian influenza viruses ("bird flus" if you must) around again - avian influenza A(H7N9) virus, or just 'H7N9'.

In Figure 1, I've taken the huge liberty of adding in the start and end dates of the 3 outbreaks of H7N9 to date; and in doing so, I've said that China is in the early stages of one right now. I may well be wrong of course - this is a blog and these are my opinions - but it looks that way to me. 

Figure 2. China's northern laboratory network influenza
surveillance data up to Week 51 of 2014. [1].
Click on image to enlarge.
The case numbers for H7N9 in Figure 1 have been above zero for a little while and in particular November looked like a busy month (see weekly and monthly tallies here). Keep in mind that there is also a reporting lag - the time between date of onset (obtained from more detailed World Health Organization data) and the date the case was publicly reported (I rely on FluTrackers line list for these details). That delay can be a month or more on occasion; up to 38-days in late December. I suspect this is because China reports cases to the WHO in batches, something instigated toward the end of the 1st and 2nd outbreaks. So I suspect we will see more cases assigned to December, during reports that come out in January.

But it look like 'tis the season for influenza in humans in China (see figure 2 and the Chinese National Influenza Centre [2]) - and as some of us have discussed on Twitter, this is most probably due to the changes in weather (environmental conditions) which result in sustained viral survival on cough and sneeze-contaminated surfaces and in wet and dry propelled droplets and droplet nuclei; in both man and bird (see Hong Kong avian influenza detection report dates [3]). 

That sustained survival may well be all it takes for more of us to pick up an infectious viral dose.

Once the seasonal influenza viruses get a foothold in us, they spread well, causing disease in those who are susceptible and probably a bunch of unnoticed infections in those with previous exposure to that strain plus a healthy immune memory of that intrusion. By "seasonal influenza virus, I mean those that replicate in and circulate efficiently among humans, as opposed to the relatively inefficient avian subtypes.

So stay tuned to H7N9; it's not yet very good at spreading between humans but its established in birds and has been spilling over into humans since at least the beginning of 2013. We know how influenza can deal us a rough hand if the stars and its genetic segments align favourably (for it). Oh, and the continued reliance on fresh chicken obtained from and killed at live poultry markets. The majority of cases have very clearly had contact with poultry as defined by the WHO. 

References...

  1. http://www.cnic.org.cn/eng/show.php?contentid=738
  2. http://www.cnic.org.cn/eng/surveillance.php
  3. http://www.chp.gov.hk/files/pdf/global_statistics_avian_influenza_e.pdf

Friday, 2 January 2015

Influenza A (H5N6) virus in humans...

Provinces hosting human cases of H5N6
Adapted from [8]
Click on image to enlarge.
After late December's announcement of a human infection with another avian influenza subtype, H5N6. The tally of human infections by this subtype of FluA stands at 2 - that are reported anyway.

The ever vigilant @FluTrackers (and their line lists, news posts and commentary) and the always alert @Fla_Medic (and his Avian Flu Diary blog) have these cases well covered.

I just wanted to make a summary here for my own reference in making some slides for a talk next month.
  1. ~23-April-2014. [1,4,5] 49-year old male (49M) from Nanchong City, Sichuan Province.
    Acute severe pneumonia, died 5-May-2014
    Exposed to dead poultry
  2. 3-December 2014. [2] 58M from Guangzhou City in Guangdong province.
    Critical condition in hospital since 9-Dec-2014
    Exposed to live poultry but not ill contacts [3]
There have also been plenty of lethal animal infections by this and other highly pathogenic avian influenza (HPAI; referring specifically to the bird's outcome) subtypes and strains [7], including:
From an OIE Report 21-Oct-2014. [6]
  1. 12,000 quails in Quang Nai Province, Vietnam in 18-Dec-2014
    http://en.vietnamplus.vn/Home/Quang-Ngai-destroys-12000-AH5N6-infected-quails/201412/59394.vnplus
  2. 1,338 birds on a farm in Nanbu, Nanchoing City, Sichuan Province, China
    http://www.oie.int/wahis_2/public%5C..%5Ctemp%5Creports/en_fup_0000015698_20140731_162951.pdf
  3. 20,550 (17,790 fatal) birds on a farm in Shuangcheng District, Heilongjiang Province, China, 23-Aug-2014
    http://www.oie.int/wahis_2/public%5C..%5Ctemp%5Creports/en_fup_0000016060_20141024_193420.pdf
  4. Birds in Muang Nan and Muang Xayabouly Districts, Luang Prabang and Xayabouly Provinces, Laos in 12:14-Mar-2014
    http://wwwnc.cdc.gov/eid/article/21/3/14-1488_article#r4
No sign of anything like sustained human-to-human transmission of this viral subtype to date. But another for the influenza virus Rubik's cube.

References..
  1. https://flutrackers.com/forum/forum/china-h5n1-h5n8-h5n6-h5n3-h5n2-h10n8-outbreak-tracking/164419-china-man-49-with-acute-severe-pneumonia-died-from-h5n6-nanchong-city-nanbu-county-sichuan-province?t=222782
  2. http://www.who.int/csr/don/28-december-2014-avian-influenza/en/
  3. http://news.xinhuanet.com/english/china/2014-12/23/c_133874590.htm
  4. http://afludiary.blogspot.com.au/2014/05/sichuan-china-1st-known-human-infection.html
  5. http://www.promedmail.org/direct.php?id=2451125
  6. http://www.oie.int/wahis_2/public%5C..%5Ctemp%5Creports/en_fup_0000016060_20141024_193420.pdf
  7. UPDATE ON HIGHLY PATHOGENIC AVIAN INFLUENZA IN ANIMALS (TYPE H5 and H7) from the Office International des Epizooties (OIE), otherwise known as the World Organisation for Animal Health
    http://www.oie.int/animal-health-in-the-world/update-on-avian-influenza/2014/
  8. http://en.wikipedia.org/wiki/File:China_administrative_claimed_included.svg#filelinks

Sunday, 2 November 2014

Influenza A(H7N9) virus: detection numbers and graphs...

This is a static page that houses my graphs of influenza A(H7N9) virus ("H7N9") numbers produced by the various Ministries of Health for the provinces and municipalities of China, Hong Kong's Centre for Health Protection (CHP) the World Health Organization and FluTrackers.

Please be aware that these numbers are in flux during the winter epidemic. They are a guide only.

There is also an accompanying map page which for now is located here.


Reminders: 
  • The graphs above, as with all on VDU, are made for general interest only. They are also freely available for anyone's use, just cite the page and me please. The data can be downloaded by clicking on the "Download" link at the bottom-right of each dashboard. It may be that I have misinterpreted the language in the reports (sometimes a little tricky to wade through) or miscalculated some totals based on the way data have been presented.
  • In any outbreak, epidemic or pandemic caused by a know or emerging pathogen, the numbers presented publicly, and used in these graphs, are expected to represent only a fraction of all the cases that have and are occurring. This is just the nature of the imperfect biological'ness of these events.
  • I am only able to plot what is publicly available-you could do this too. No secret associations or back-room deals provide me with these data.

Saturday, 4 October 2014

What words would you use to separate influenza spread from Ebola virus disease spread?

I need your help.

I have spent umpteen hours on trying to make this message simple. None of that has been aided by the way that the CDC, the WHO and now the UN use the terms and words confusingly to convey messages to the public. The message is often delivered as if they were sitting around their meeting rooms talking to other health and science professionals. In my opinion, we all look to these guys for simple clear and consistent messages. Right now they need to do much better to convey complex concepts, simply, quickly and more often. Education helps prevent panic, mistakes and conspiracy theories (well-as much as anything can anyway).

So here is another attempt by me to get this wording into line with what the rest of world can make sense of. 

I could also really use your input to make this work - so leave a comment below, or Tweet me @MackayIM or email me or send me a carrier pigeon - with how to make this message simpler for you and your kids and your grandparents and that weird uncle you stay clear of at Christmas, to understand. 

Let's crowdsource a solution to this confusion, help out others and then see if the major public health bodies can come on board.


Propelled droplets versus a cloud of suspended.
This post and issue have been fuelled most recently by the Ebola virus disease (EVD) epidemic but is also fuelled by my experiences in talking to people about the MERS-CoV and influenza A(H7N9) virus outbreaks. They are respiratory viruses while ebolaviruses are not. Different viruses yes, but common concerns for people and to the issues around trying to understand overly technical terms when they are used differently in everyday life. 

Public health speaking is very public.

Public health issues are spoken about on a global stage, more now than ever. It is up to us to better define the right words and use them consistently. That has definitely not happened for "aerosol" and "airborne". 

We professionals can't just sit back and expect our stakeholders to come along with us for the ride - they will get confused when imagery conflicts with lingo and official statements, and when different public organizations disagree with each other or use tiny but significant differences in their language to communicate risks. 


People are not stupid and deserve more respect than they are currently getting from those who should know much, much better about how to work alongside the public (public health and all).  


So what is the problem here? 


Droplets would probably be an ideal word to differentiate from airborne - and it has been used to differentiate the level of precautions of personal protective equipment (PPE) to prevent infections - droplet precautions and airborne precautions - but the evil physicist types have ruined the use of that word for us by introducing droplet nuclei (the part of the aerosol that lingers in the air and can convey those viruses that survive in it, to a new person to infect them). Physicists like technicalities.


So the problem is trying to define a name for that other process that can simply and clearly describe infectious disease transmission of viruses & bacteria that are propelled from/by the sick person, across the gap between them and an uninfected person, measurably infecting the recipient. The name should make clear that it is a different process to the one that sees a person get sick by inhaling infectious viruses or bacteria held aloft by the air, in a cloud, made by a previously ill person, that has been hanging around for perhaps an hour or more. That one is an airborne route of transmission. 


Some people have berated me for talking technicalities and semantics in recent days while I try to better define this. Tough! Water off an influenza-host's back. Words have meaning and impact and useful words are needed. Especially when everyone is freaking out over a disease they have only read about in dramatized books or seen in Hollywood blockbusters. The two processes listed above are distinct and different for some viruses & bacteria. But it is biology and nothing is 100%, except death. 

Some infections, like those leading to influenza, could result from both processes. Some, like Ebola virus disease have never been observed in humans via one route (airborne), whereas there is a defined risk of them occurring by the other (direct contact between a range of virus-laden body fluids propelled onto a mucous membrane). Yes, coughing a tiny barely visible droplet onto someone else's mouth is direct contact between the wet fluids and the mucous membrane.


They two processes are battled differently. We protect ourselves from them differently. And names can tell us about the different levels of risk. But what is that other route to be called? 


I have an idea. First some perspective.


Ways to think of the differences.

A word cloud of ways to think of the
two different processes of spreading viruses
or bacteria that result in infection and disease
in humans.

v2 Thanks to Nina West for good analogy (Fog/Rain)


The idea.

How about we call the process of relatively short (up to about 3m) distance, coughed/sneezed/vomited wet droplet transfer of disease-causing doses of viruses or bacteria, "Propelled"?


Over to you, world.

Some greats from the comments below...
  • "void the spray and live another day"
  • Only touched by air, no need to care. Where it splatters, that's where it matters

Monday, 29 September 2014

The numbers are underestimates...

Ebola virus numbers.

Sorry but D'uh - yes the numbers during the Ebola virus disease (EVD) outbreak happening since December in Guinea then progressing to Sierra Leone, Liberia, Nigeria and Senegal....are an underestimate. 

Of course they are! 

How could they possibly not be?

Have you not watched a single documentary or news video detailing how heartbreakingly difficult it is to visit and help the people of West Africa, to characterize and gather those case numbers, to take, transport and test samples?

The suspect cases are an underestimate. 
The probable cases are an under-estimate. 
The fatal cases are an under-estimate. 

The only thing that is spot on is the laboratory confirmation numbers, because they are what they were when someone wrote them down having had some semblance of control over the steps to acquire them. 

But let's put that underestimation into context. 

"The tip of the iceberg"
Image originally provided by Gregory Haertl, WHO.
Click to enlarge
Influenza case numbers each year are also an under-estimate. 

In fact, some of those, the subtyping numbers, are deliberately so because it's too expensive and wasteful to subtype every single laboratory confirmed case - so a sample of cases are tested and that is assumed to reflect the subtype distribution for that region during that period. 

But seasonal influenza case numbers as a whole are a huge underestimate. Influenza does not drive everyone to a general practitioner nor to a hospital. Some infections with influenza virus don't even produce noticeable symptoms at all. They are still infections. They just don't get counted. So influenza A virus, possibly the most tracked of any respiratory virus, is underestimates. And that's okay. 

Well, measles too, in the respiratory virus department. 

The latest big bad is the species D enterovirus 68 (EV-D68). But the paltry few detections of it (identified by genotyping) that have reported across the United States are likely a monstrous underestimate. In fact we have very little idea of a normal denominator for EV-D68 detections so it's hard to even know if 2014 is seeing all that big a change in its spread and distribution. Usually the enteroviruses (includes rhinoviruses) cause common cold-like illnesses and only get sought out in the great detail from a research point of view.

Middle East respiratory syndrome coronavirus (MERS-CoV) cases or the emerging influenza A(H7N9) virus cases are all underestimated as well. 

The population of your state or country is an underestimate too you know?

This is because we cannot capture every single case of infection, or person, at once. 

So the next time you are about to say "the WHO numbers are an underestimate" as if that is a revelation or an unexpectedly horrible thing you can also lay at their doorstep - please just don't. It's not smart, new or unusual.

You might as well say the world is round; underestimation of infection numbers is just that well established a fact. It's just by how much, and frankly that doesn't even matter too much because the trends can usually be easily seen, or quickly extrapolated.

Perhaps you did not know all that before. But if you have read to here, you do now.

Sunday, 20 July 2014

Now for something (not so) completely different: H7N9 maps...

Now it's time to mess around with influenza A(H7N9) virus mapping using Tableau.

I've (only just) realised the my esteemed peer, Shane Granger has been using Tableau to do this for ages (see here), and that this will be duplicating his excellent work. So I'll try my best to consciously differentiate my maps from his - but there's only so far you can go with that and there will be overlap. 

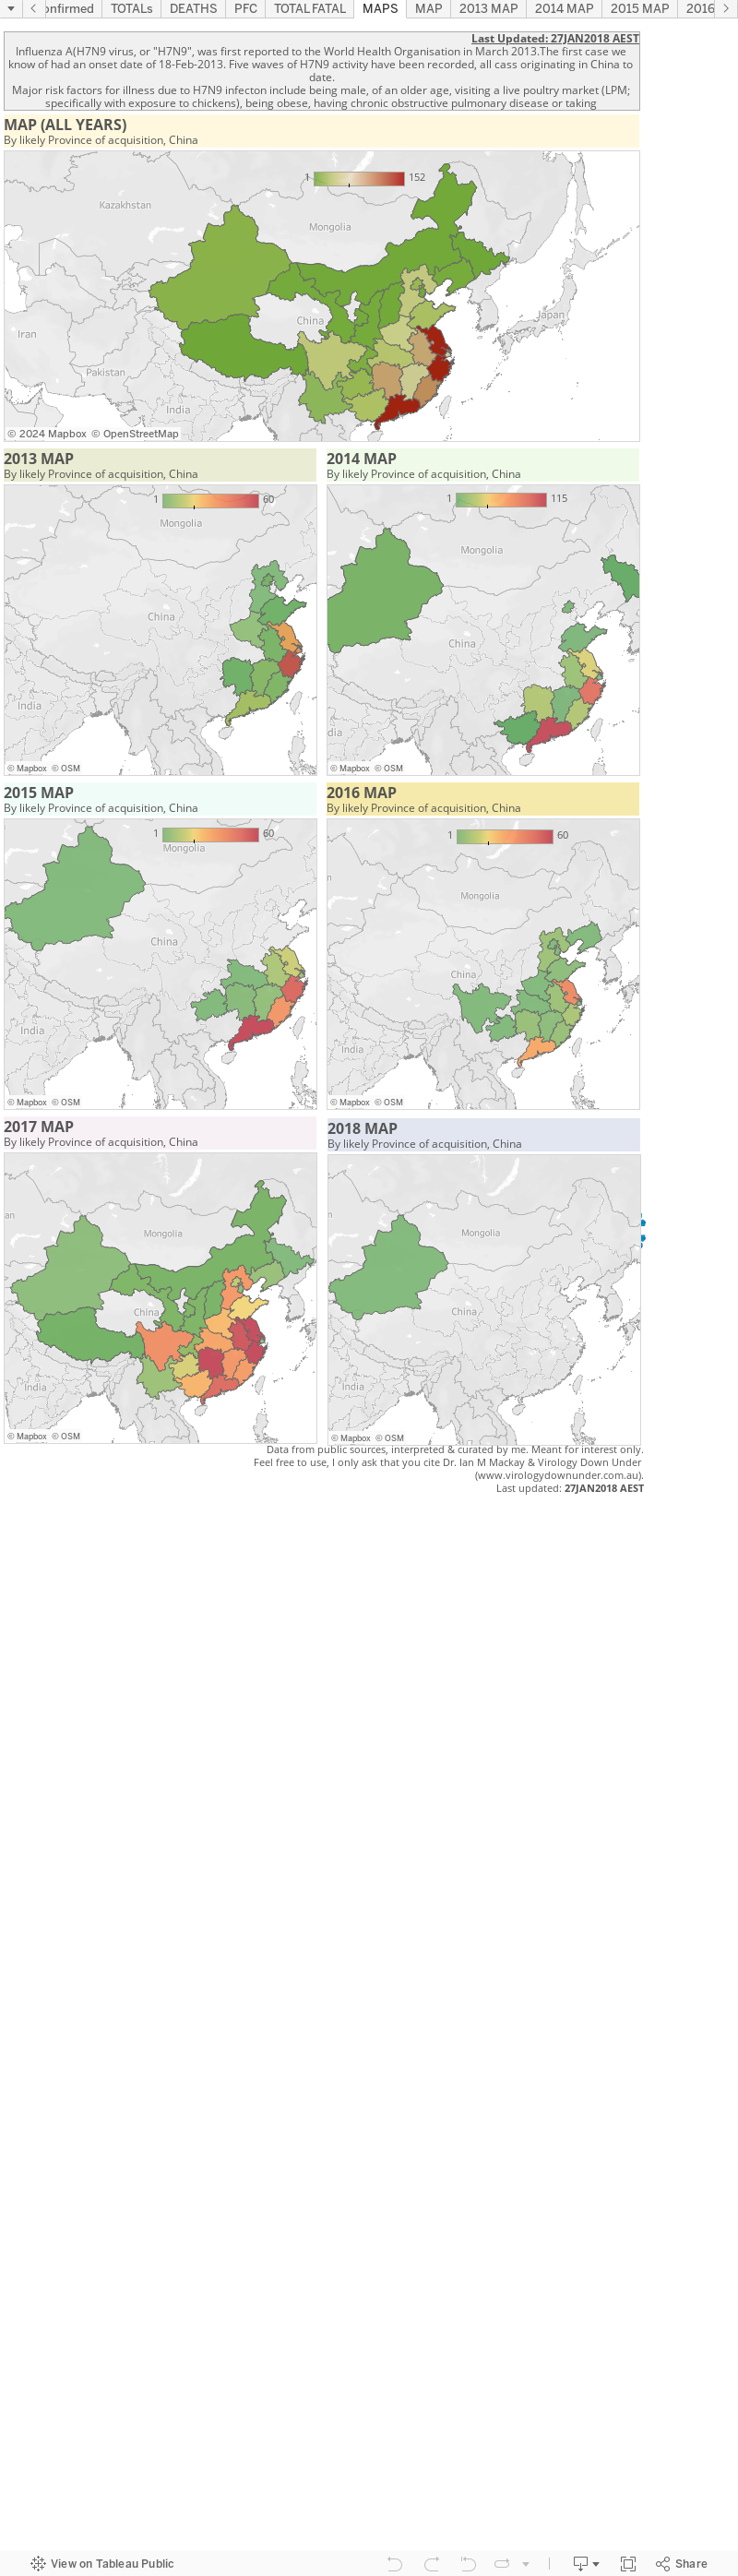
The page below is a very early first play with H7N9. It's just detections broken across 2013 and 2014, by province most likely to have been the source of the infections (as far as I can tell) in mainland China. 

If I can master this I'll try and add more details in the future. For now, these numbers a a little out of date but he trends are similar. This charts 449/452 detections.


Monday, 28 April 2014

H7N9 Snapdate: some quick charts...

Click on image to enlarge.
I don't have a lot of time tonight so this is just a quick post of some updated charts with a few summaries of some key features of the influenza A(H7N9) virus situation in south-eastern China. At writing it was at 432 detections with media reporting 128 deaths

Click on image to enlarge.
Guangdong is where H7N9 is still most active and it is this province that is the source of the continued cases trickling off Wave 2's peak.

Most H7N9 cases overall have been in Zhejiang and Guangdong provinces but lately, post-peak of Wave 2, there has been continued activity in Jiangsu province including a recent healthcare worker with no mention of "contact with poultry"; the absence of which stands out in World Health Organisation (WHO) reports because most cases are followed by affirmation of that phrase.

Click on image to enlarge.

In  the  survival chart above we see that most of the fatal cases, shown in red, are defined by an older age. Unfortunately, a lot more of the fatalities have been reported through the media without identifying details (48 of 128), than have come through official Chinese channels and out via the WHO. This lack of detail makes it impossible to clearly link a lot of the deaths to the case announcements. Only the custodians of these data know what this chart should really look like. NB: Since making the chart this morning I've found a handful more case details at FluTrackers, but public detail on fatal cases remains the weakest of any of the H7N9 data.

Click on image to enlarge.
We can see in the weekly chart on the right that the two H7N9 waves differed in timing, the width of their bases (more cases in Wave 2) as well as how "tight" their peaks were. Wave 2 has tailed off, but continues to spit out cases, while Wave 1 comprised both a steep climb and a steep decline in human cases.
Click on image to enlarge.

If we zoom in on Wave 2 we can see by looking at cases per day in the chart on the left, that between 0-4 illness onsets per day are being reported, as they have been since late Feb-2014. 

Is this the legacy of those regions whose live bird markets remained open or were only shut temporarily for disinfecting and restocking? Those regions with markets that were shut for much longer, or for good, do not seem to have contributed much to the continuing leak of H7N9 infections despite being key contributors during the peak periods before markets were closed.

Click on image to enlarge.
In zooming in on Wave 2's cases by week, but this time based on the region of likely acquisition of infection, we see that Guangdong province (brown line) has been the most consistent contributor of human H7N9 infections both late during the 2nd of the Wave 2 peaks, but also after the peak's decline almost everywhere else in south-east China. There was considerable publicised unwillingness from poultry producers to permanently close markets in this Province, a location with a major role in the nations poultry production. And so this little experiment incubates further and I have little doubt we will see the impact of that unwilingness late in 2014. 

Click on image to enlarge.
As noted above, public H7N9 death data do not allow good linkage with official case announcement data for about 48 fatalities, so my second-last chart tonight uses both public and media-release numbers to try and illustrate how the proportion of fatal cases (PFC) has changed across both Waves. The PFC seems to be holding fairly steady now between 17% and 30% (depending on source of numbers).


Click on image to enlarge.
And finally we see that the age and sex distribution across all cases (both Waves) is skewed to wards older males. Same as usual. If we look at this distribution (ran out of time to put in here) for the fatal cases, it is much more tightly grouped around the >60-year olds, but that females appear to dominate males in deaths during Wave 2, whereas it was the other way around for Wave 1.

Saturday, 19 April 2014

Watching zoonoses evolve...

Special guest writer: @influenza_bio

For the first time in human history, we are watching diseases jump from animals to humans on a large scale. We've seen diseases appear for the first time in humans before; that's not new. We've seen HIV and several new strains of influenza emerge over the past century or so, for example. What is new is that we can now watch this process as it happens. We are able to watch animal diseases trickle case by case into humans, and we wonder whether any of these diseases might some day become human diseases. We wonder whether we might be watching pandemics develop in real time.

A disease that jumps from a non-human animal to a human (or the other way around) is called a "zoonotic" disease or a "zoonosis." Individual cases are called "zoonotic" cases. When a zoonotic disease is trying to make the jump to us permanent, we call this disease an "emerging infectious disease."

We have certainly been watching a lot of zoonotic MERS coronavirus and bird flu (e.g., H7N9 and H5N1) cases develop in people lately, along with Ebola virus cases. Zoonotic cases of other diseases, including infections with various strains of bird and swine flu, occasionally develop, as well, and are watched closely.

When the 2009 H1N1 flu pandemic started, we had no clue much beforehand that it was on its way.  We didn't even have surveillance data about swine flu strains that were even particularly close to the strain that emerged in us. A large animal flu surveillance gap blindsided us that year.

And we will undoubtedly be blindsided again by other emerging infectious diseases that we won't even see coming, although people are doing their best to see what's out there.

When an emerging infectious disease jumps to humans, it can cause either a relatively local outbreak or a worldwide outbreak, called a "pandemic." If a disease becomes a pandemic, that just means that it's spreading worldwide; the word "pandemic" doesn't imply anything about how bad the disease might or might not be. In some sense, the worst case can be when a disease jumps to humans and becomes "endemic" in humans, meaning that it gets established in people and regularly infects people, year after year. Endemic diseases can circulate worldwide (e.g., influenza) or in more restricted geographical regions (e.g., malaria).

Our knowledge and resources have grown to the extent that we are currently able to monitor some significant zoonotic outbreaks of disease. We are currently watching the MERS coronavirus and the influenza A(H7N9) virus both try to become human viruses.

Will either one succeed? We can't say. We've never watched this process happen before. We don't know how long such a process "usually" takes, or whether there even is a "usual" amount of time that it takes. We don't know how long it might take, or how quickly it has happened before. We do know that the process is "stochastic," meaning that it involves a lot of chance. A pathogen that in one situation might cause a pandemic might just die out in another situation. Everything depends on the specific changes in a pathogen that get a chance to develop and on whether those changes end up getting passed on. We don't know how often pathogens "fail" when they "try" to make the jump to humans.

A lot of us have watched the recent surge in MERS coronavirus cases with some amount of concern. As of April 19, 2014, there are two large clusters of cases in the Middle East, and at least one of them is still growing. One cluster, in Jeddah, Saudi Arabia, now has 60 cases; 7 cases were added to this cluster today, and 6 were added yesterday. There are perhaps over a dozen cases in another cluster in the UAE. One patient who became ill with MERS in Jeddah at the end of March flew to his home country of Malaysia while ill and subsequently died in Malaysia; 79 of his contacts are now being watched closely in Malaysia. Test results are starting to come in for a number of these contacts, and thankfully all are negative for MERS so far. An asymptomatically infected Filipino health care worker traveled on an airplane back to the Philippines a few days ago. Yesterday, a MERS case was announced in Greece; a Greek man who had been living in Saudi Arabia was recently in Jeddah and presumably became infected there before flying back to Greece. He arrived in Greece with a fever; his contacts are now being monitored. In other words, MERS case numbers are growing quickly right now, at least in part through human-to-human transmission, and infected – and potentially infectious – patients are getting on airplanes to travel around the globe.

Does what we're seeing now represent changes in the virus that are making it more transmissible among humans? Or are we seeing a random fluctuation in the numbers of cases? Or, are we seeing more cases simply as a result of improved surveillance? I would argue that what we're seeing likely reflects one or more changes in the virus, simply because
  1. We've been seeing so many more symptomatic cases recently, 
  2. We've been seeing significantly larger clusters than we've ever observed before,
  3. A greater number of health care workers appear to be getting infected than ever before, and
  4. A greater proportion of cases are in health care workers than ever before. 
It's not that we've been seeing a rise only in the number of asymptomatic cases detected, which could suggest that we're only seeing the effects of improved surveillance. Moreover, while surveillance does seem to be picking up more mild and asymptomatic cases, it is difficult to know whether we are seeing more of these cases because of improved surveillance or because there simply are more such cases now. A lot of variables are being changed at the same time, and we don't have perfect information.

Nonetheless, the sheer numbers of recent cases suggest to me, at least, that the virus is changing and becoming more transmissible among humans. Until recently, we rarely saw evidence for human-to-human transmission of MERS; most cases may have been zoonotic. Now, however, large clusters involving roughly 1 to 4 dozen people are being seen, with single infected individuals infecting possibly up to a dozen or more other people. This is new. I don't think that we're seeing these clusters just as a result of improved surveillance, although I would be very happy to be wrong.

What does the future hold for MERS? We can't know. We might be watching MERS become a pandemic, and we might not. We might be watching the current relatively small MERS outbreak develop into a larger outbreak that eventually gets contained, as was seen with SARS. Or, the whole outbreak might all just simmer down or go away. Even if the virus were currently changing to become more transmissible, the current spate of cases could still simmer down or go away, just stochastically, just through sheer chance.

Prudence would dictate that we remain concerned and vigilant, however, especially as symptomatic MERS cases have had an approximately 40% case fatality rate (CFR). If MERS did cause one or more wider outbreaks in humans, that CFR might or might not change. Even if the CFR dropped to 10% of what it is now, it would still be on the same scale as the CFR for the 1918-19 influenza pandemic.

As a global society, we have an obligation to do everything in our power to prevent the MERS coronavirus from causing larger disease outbreaks in humans. We need more surveillance in affected countries, including much more genetic sequence data. And in countries of the Arabian Peninsula that are currently detecting MERS cases, infection control procedures need to be improved to the point where nosocomial cases in health care workers and patients are prevented. Health care workers in other countries should be educated about the possibility of MERS patients arriving from afar and about how to treat such patients safely. If this virus becomes more transmissible, we should not be caught unprepared. We can see this one coming.