Showing posts with label coronavirus. Show all posts

Saturday, 23 May 2015

A good week for viruses...not so great for humans...

Edited for clarity 25MAY2015
Middle East respiratory syndrome coronavirus (MERS-CoV) managed to get out for some sightseeing - travelling to South Korea this week - and Ebola virus|Makona was given a helping hand to spread to new people in Guinea and Sierra Leone with a small splurge of new confirmed cases.

MERS has now trickled into 24 countries world wide as shown in the European Centre for Disease Prevention and Control's (ECDC) epic 'travel-by-plane' map.

Media preview
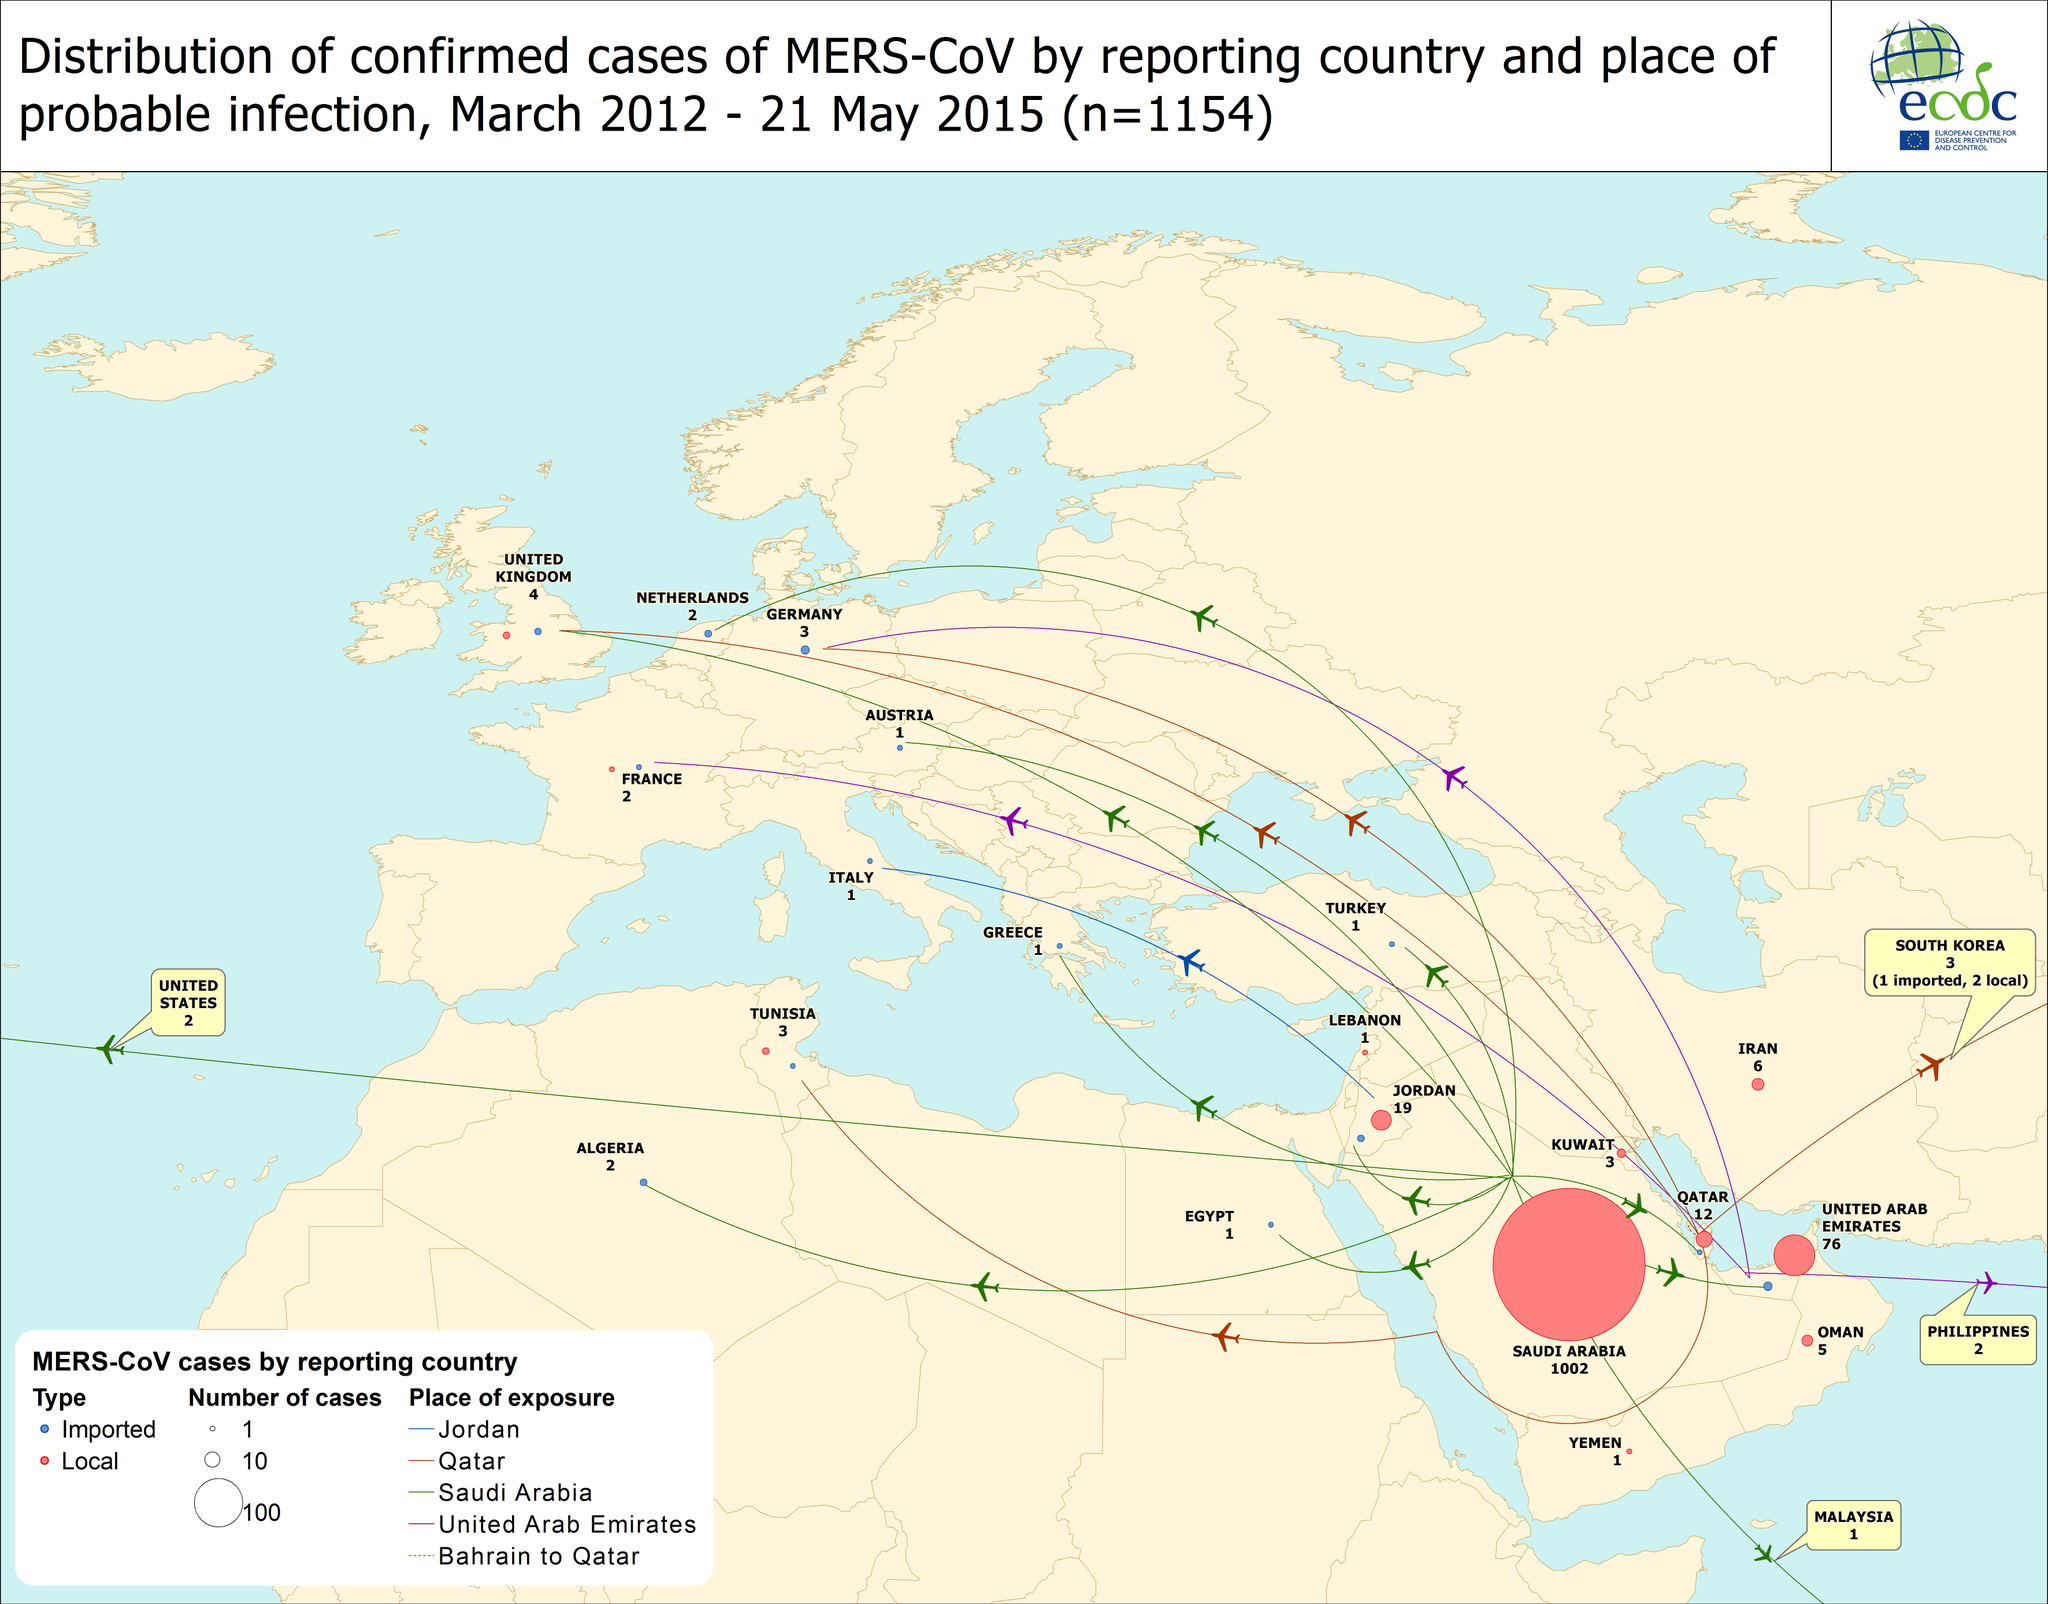
The original of this is created by the ECDC and is presented here.
Click on image to enlarge.
Meanwhile, a crude extrapolation from current Ebola virus disease (EVD) case numbers saw the predicted date when we might reach zero cases, move further into June. 

This could pull back again or it could move further away if the EVD clusters and sporadic cases continue to spread. We can't model that because it's entirely down to unpredictable human variables. We can list what those are, we can better prepare for them, we can educate about them and how to prevent them and we can acknowledge that they are real, but we cannot know when and in what mix they will come into play.

Extrapolation of the public data for confirmed Ebola virus disease cases from
WHO. The most recent week is boxed in red and bucked the trend of declining
 cases. To see how I made this please visit here.
Click on image to enlarge. 
The newest EVD cases remain mostly clustered around the Forecariah prefecture of western Guinea, on the north west border with Sierra Leone but also 5 new cases appeared in the north west of Guinea in Boke prefecture, which borders Guinea-Bissau. 

Geographical distribution of new and total confirmed cases
From the World Health Organization's Ebola virus disease Situation Report, 20MAY2015.
Click on image to enlarge.
Since the last EVD SitRep, two days of reporting have seen fewer cases than in the same two days of the week before. 

So there's that. 

Quickly reporting what is actually happening is invaluable for all sorts of reasons. Modelling and prediction allow us to get ahead of the virus. But having the data, and having them available publicly remains a challenge for every country and for every outbreak. 

Public health data are about the public's health. If it has been considered worth collecting and collating, why not communicate it too?

Tuesday, 5 August 2014

MERS-CoV: maps, totals, sex, age and different populations

This is a static page - the internet address won't change, just the charts as I add new numbers and update them. The page will follow Middle East respiratory syndrome coronavirus (MERS-CoV) detections by day, month and the cumulative tallies, worldwide and focus on subset of the numbers that are public available. That means these graphs are at the mercy of each nation's willingness to provide basic, deidentified (so patients are never publicly identified) information. 

At a minimum these could include:

  • a unique case identifier (preferably in collaboration with country where diagnosis was confirmed and used by all)
  • age
  • sex
  • date of illness onset (DOO; when they first became ill; preferred value to use top plot cases along the bottom axis of the graph)
  • date of hospitalization (DOH; if no DOO - the I plot using this*)
  • date of laboratory confirmation
  • town & country of diagnosis
  • whether a healthcare worker
  • whether underlying disease (comorbidities) were present
  • animal contact if a possible or known zoonotic disease
*If no DOO or DOH - then I plot using the date of reporting.

Data visualization ("viz") 1.
This breaks down the living (yellowish) and dead (red; when they died) people from which MERS-CoV was confirmed by a laboratory, either as viral RNA-positive using RT-PCR or by the detection of an antibody response. The graphs also show the counts as per day, per week and per month to cover a range of different 'ways' of looking at the numbers. In the Monthlies graph, I have nested a Table that shows how many healthcare workers (HCWs) have been infected and that that equates to as a proportion (%) of all detections from that country.


Data viz 2.
This is a cumulative curve, It adds the newest case numbers to the total from the timepoint before and so it shows the growth of cases - in this case, of all MERS-CoV detections worldwide. I've marked some pints of interest. These are usually clusters or outbreak and cause a sudden rise in case numbers, seen as a steep curve; a change in rate of case growth. As the cluster or outbreak resolves, the curve "slows down" which can be seen as it levelling off to a horizontal line.


Data viz 3.
This is a series of 'heat' maps with time. They plot the density of MERS-CoV human cases in terms of colours - the more cases in a region, the more warm (red) the colour is. The fewer cases, the more cool (green) it is. There is a scale to show you some more detail.


Data viz 4.
MERS by region of the Kingdom of Saudi Arabia. This is another way to track which region or province is the hottest spot. It does not account for the creation of "MERS-specific clinics or hospitals to which cases from other regions may be being transported.


Data viz 5.
MERS by age and sex. This includes a table of the current global total number of MERS-CoV detections and highlights the gaps in my line list of age and sex data. 
There is a global age and sex bar graph (male-blue;female-pink-sorry; green-no sex data). 
Next are age/sex pyramids for the world, the Kingdom of Saudi Arabia, pre-Jeddah and then the Jeddah and South Korea hospital outbreaks.
These graphs highlight the different distributions during times of sporadic cases or times of clear outbreaks. They also highlight that more cases are male and show some difference between cases and fatal cases as well as differences between Saudi Arabia and an outbreak in another country-highlighting how important the health of the community is to the impact of the same virus.

Data viz 6.
This is an odds and ends viz of some subpopulations. 1st there is a panel looking at the number of comorbidities over time (orange line) against the total case numbers (pale brown mountain), globally; 2nd is the number of times an animal (brown), or specifically a camel (yellow), is mentioned alongside a case; 3rd is a plot of the cases identified as having a role in healthcare, again against a backdrop of the total MERS cases worldwide. This lets us see increased spillovers and, usually with hindsight, associate them in time with a spike in cases. It also shows the intimate relationship between MERS and the healthcare environment as healthcare worker numbers spike along with an overall rise in cases.

Data are derived from the World Health Organization, FluTrackers and various Ministries of Health.
The chart above, as with all on VDU, is made for general interest only. It is also freely available for anyone's use, just cite the page and me please. 

Wednesday, 5 February 2014

Middle East respiratory syndrome coronavirus (MERS-CoV): summing up 100 weeks

We stand at 182 cases with 78 deaths. The proportion of fatal cases (PFC) stands at 43%.

  • Median age of all cases, including deaths, sits at 53-years (missing data on 13 cases); median age of fatal cases is 60-years
  • 47% of all MERS cases with data are >55-years of age; 36% are >60-years
  • 65% of cases are male (missing data on 18 cases)
  • Underlying comorbidities feature in most severe disease MERS cases
  • Approximately 18% of MERS-CoV cases are in healthcare workers; 2.7% of all fatal MERS cases are HCWs
  • 81% of case are from the Kingdom of Saudi Arabia (KSA); the Arabian peninsula is the zone of case origin
  • Reliable real-time reverse transcription polymerase chain reaction (RT-rtPCR) assays exist for detection, confirmation and genotyping
  • Camels have been found on multiple occasions at multiple sites in the region to have antibodies to an antigenically similar virus to the MERS-CoV and nasal swabs have been found to be MERS-CoV RNA positive, as have humans in contact with the same camels (infection direction unknown). 
  • Camel, goat, monkey, alpaca and human cells lines efficiently replicate MERS-CoV (multiple intermediate sources?)
  • 1 diagnostic sequence of MERS-CoV RNA has been identified in a Taphozus perforatus bat (origin of animal other infections?)
  • MERS-CoV uses DPP4 (CD26) as its receptor on host cells, a molecule found on some cell lines and epithelial cells of kidney, small intestine, liver and prostate. DPP4 has a standard role in hormone and chemokine activation
  • No viable antiviral therapy or cocktail exists to treat infection. No vaccine exists.
  • MERS-CoV replicates well in the lower respiratory tract of lab-infected macaques
  • Person-to-person (p2p) transmission of MERS-CoV is sporadic
  • Genetic variation among MERS-CoV genomes suggests multiple insertions into humans from the source(s)
  • Fever, cough and shortness of breath in >70% of 47 cases in KSA; runny nose in 4%; abnormal chest X-Ray in 100%
  • Sample often, sample lower respiratory tract to increase chance of successful RT-PCR result 
  • Testing 5,065 hospitalized patients, healthcare worker contacts and family contacts found 2% (n=106) positivity over 12-months, in Saudi Arabia 
  • MERS-CoV has circulated in KSA during several mass gatherings (2x Hajj pilgrimages and Umrah) providing ample opportunity for p2p transmission. There has been no evidence for an uptick in p2p transmission. We are nowhere near the verge of a pandemic.

Friday, 6 September 2013

New coronavirus genomes....not MERS yet

Unfortunately they aren't MERS-CoV genomes.

Nonetheless, a whole lot of new feline, porcine, murine, SARS, 229E and HKU1, genomes have been directly released from the J. Craig Venter Institute.

These now appear on GenBank with non-sequential accession numbers around the KF272920-KF530271. The sequences were produced using next generation sequencing technology.

Looks like the virome is in the sights of the big data guys.

Monday, 12 August 2013

Coronavirus family tree....

The phylogenetic tree below shows the relationships among the four genera of coronaviruses (CoVs); Genus Alphacoronavirus, Betacoronavirus, Deltacoronavirus, Gammacoronavirus

This tree is based on full length genomes (nucleotides; aligned using Geneious Pro; Neighbor-Joining tree built using Mega with 500 bootstraps). 

The MERS-CoV clade of betacoronaviruses is marked on the left and the endemic human CoVs are indicated with yellow triangles.


Thursday, 8 August 2013

Infection Prevention and Control measures for MERS..mostly as per other ARIs

Thanks to Mike Coston for help and tips.

Cases are few and details are incomplete but the authors of an article in the recent MERS-centric issue of the EMRO Journal, recommend following the basic protocols you would to suppress spread of any virus capable of causing an acute respiratory infection (ARI) with a leaning towards those that worked well to interrupt hospital-based spread of severe acute respiratory syndrome (SARS) coronavirus.

Some key points from the paper, of highest relevance to our current knowledge of the  MERS-CoV are  listed include (not in specific order or priority):

  1. Identify patients with ARIs and prevent them from transmisttign the agent to helathcare worklers and patients
  2. Droplet and contact precautions for people with ARIs
  3. Separate ARI patients by ≥1m from other patients and from HCWs
  4. Use personal protective equipment (PPE) including eye protection, gloves, long-sleeved gowns and surgical mask/procedure mask/particulate respirator if aerosol-generating procedures are to be performed (tracheal intubation alone or with cardiopulmonary resuscitation or bronchoscopy being notable risks)
Mike Coston's description of the mask debate is very helpful for #4 above.

If a particular infectious diagnosis can be made, then patients with that diagnosis, say MERS-CoV,  can be cohorted - co-located to minimize spread to uninfected patients and maximise specialised care and efficient use of available resources.

Specifically, the article includes a list of SARS-like IPC precautions listed include which may be useful for known MERS-CoV infections. Many of these apply to ARIs due to endemic respiratory viruses and novel influenza viruses in general though:

  • Good hand hygiene
  • Use of PPE (gloves, gown, eye protection and medical masks for HCWs, caregivers and the patient if oputside their room
  • Particulate respirator for aerosol generating procedures
  • Separate, adequately ventilated room
While the above is written for dealing with infection in a healthcare setting, the WHO have also just released a rapid advice document for those caring for mildly ill MERS-CoV-infected people without underlying conditions, or those recently discharged from hospital. A mashup of 16 distinct points (read the document to see the full language and exceptions) home IPC are:

  • Limit contact with the ill person - maintain distance (perhaps limit exposure time?). 
  • Do not allow people at increased risk to care for the ill person
  • Hand hygiene and respiratory hygiene are important as are appropriate (soap and water, bl;each as recommended) cleaning of all surfaces in contact with the person or their secretions - kitchen, bathroom, toilet, bedframe, bedside tables, furniture etc
  • Discard contaminated tissues, masks etc
  • Clean clothes
  • Do not share eating utensils food or drionk, towels or bed linen
  • Caregiver to wear a mask - discard after use and do not handle while in use
  • Ventilate shared spaces

Close medical supervision is recommended for symptomatic or probable MERS cases and their contacts.

The WHO home care advice also notes lack of evidence for transmission of MERS (the disease) from asymptomatic, pre-symptomatic or early-symptomatic people. Thus quarantine or isolation of asymptomatic cases is currently unnecessary but possibly exposed people should monitor their health for 14-days.


Key documents and official websites to be familiar with:

Wednesday, 7 August 2013

Tracking MERS-CoV through time: a spikey problem

This morning on Twitter, Helen Branswell (@HelenBranswell) asked this question, with a comment...

So I thought a little perspective might be nice. 

The SARS epidemic had its origins around Nov 16th 2002, although the major activity started in Feb of 2003. 

  • 64 human SARS-CoV genomes had been produced by September 2003 ([UPDATED:] see Science paper). That is by 317-days later, or 10-months, 13-days (perhaps less given that the genome sequences were possibly sequenced well before the paper was submitted e.g. late phase genome s seem to have been submitted to GenBank by July 2003). 
  • For MERS-CoV we currently have 9 genomes at 505-days (give or take), or 1-year, 4-months.
Not that anyone needs to be reminded, but 80% of MERS-CoV cases come from the Kingdom of Saudi Arabia. The world is relying on them, or their collaborators, to turn the nucleic acid extracts used to define these cases (PCR-POSs hopefully kept in a -80'C freezer), into templates for gene or genome sequencing.

I personally don't believe we need to have complete genomes right now in order to fulfil the fairly urgent public health need to monitor the virus and notice if it changes, or is changing, or is not changing. These changes tell us whether the virus is still adapting or has settled in - perhaps having done so prior to this outbreak's indicator, severe disease. 

What else to use to track adaptation?

Perhaps the 4,000nt Spike (S) gene, or some smaller but suitably variable portion of it, could be a target for sequencing? 

Zhang and colleagues have data showing it could be used to track an animal coronavirus's adaptation to humans, through its 3 pandemic phases. This was done using phylogeny (a way to show how one sequence relates to another through time and space) of nucleic acid sequences and alignments of the translated version of these sequences. All we need is primer sequences that could be used to reliably amplify the S gene of the MERS-CoV. If anyone has those already perhaps they could publish them...if they haven't already. A very brief look at the 9 MERS-CoV genomes already shows some variety. Perhaps unsurprisingly, there is very little change among the 4 Al-Ahsa genomes; their collection dates are separated in time by 17-days.

This shows a schematic of the aligned Spike genes. The black lines within the grey boxes represent nucleotides that differ from the consensus. More differences are obvious in the earlier sequences. The oldest MERS-CoV isolate is at the bottom, the most recent, at the top (detailed below). See the full version here at VDU.
Interestingly, the phylogeny of the complete Spike genes looks  similar to that of the complete MERS-CoV genomes. However  its doe snot place the isolates in order of increasing time to the extent that the full genomes do. I also looked at a 900bp fragment of the 3' of the Spike gene - easier to amplify but a very similar tree to that of the complete Spike.


All 9 complete MERS-CoV spike protein genes (nt). Alignment in Geneious Pro, tree in MEGA 5.10.
Full version will be here at VDU.

All 9 complete MERS-CoV genomes (nt). The arrow indicates moving forward in time; the oldest MERS-CoV isolates at the bottom, the most recent at the top. Alignment in Geneious Pro, tree in MEGA 5.10.
Full version will be here at VDU.

So where does that leave us?

Adaptive pressures on the SARS-CoV drove its genome towards settling down in the late stage of the 3-phase outbreak (defined by the Chinese SARS Molecular Epidemiology Consortium), with changes in the Spike gene occurring before that. Complete genomes are clearly the gold standard - so I dial down that personal belief from earlier.

The Spike gene still seems a useful target for MERS-CoV too, although not as accurate at plotting the time of virus isolation as complete MERS-CoV genomes were in my example above. Still, it, or some part of it, is still of use as an early-warning system to alert us to viral change and it will prove easier to amplify by smaller or less genomics-focussed laboratories. Something we need to consider in order to get some information, which is far better than none.


While we've seen predictive modelling for the age of MERS-CoV, we don't actually know when the virus came to be or when it started spilling over to humans. More full genome sequences would certainly help address that question. And finding its origin.


However, perhaps we should make the trade off and use the 3' end of the Spike gene now, in an effort to keep some sort of eye on how the MERS-CoV is travelling? Anyone else have a good region that fits the bill?

Time for the bat signal? The need for an animal model for Middle East respiratory syndrome coronavirus.

Elizabeth Devitt notes in Nature Medicine, that unlike its cousin, the severe acute respiratory syndrome coronavirus (SARS-CoV), some important features of MERS-CoV including its transmissionincubation period, and ability to spread systemically within the host, have not been able to be defined for the MERS-CoV using non-human models, because the virus does not like to infect the same animals. 

When the MERS-CoV infects a larger non-human animal, the rhesus macaque monkey, the disease it produces, while still defined as pneumonia and proving the casual link between MERS-CoV infection and disease, resolved faster and was not as severe as that in humans. These animals are also not easy to work with. I wonder if older monkeys with comorbidities have been looked at in particular? [UPDATE: The macaques above live to about 25-years]. It is this population in which MERS is most severe. Nonetheless, the monkey studies provide an excellent vehicle on which to test the usefulness of 2-drug an antiviral approach (Falzano et al, described earlier) that can clear MERS-CoV infections in vitro.

While cell/tissue culture methods using primary human airway cells have proven extremely useful for looking at cellular biologyantiviral effectsand immunobiology related to MERS-CoV infection, something with legs will be needed for future vaccines and to address the list above. We've seen many examples of how animal models massively improve our understanding of influenza virus pathogenesis, if an example is needed.


Also according to Devitt, Ian Lipkin is still wading through the data from samples collected from a range of animals that may be the natural hosts for the MERS-CoV in Saudi Arabia. Meanwhile, we recently learned of another CoV (PML/2011) found in the fecal pellets from a South AfricaNeoromicia cf. zuluensis bat in 2011. PML/2011's nearest CoV relative was the MERS-CoV - its closest viral relative found to date (at least in the conserved RdRp region used by the authors).

This all begs the question, is there a bat animal model? CoVs, but also studies of other viruses like Hendra and Nipah, would benefit from a well-defined model based on these critters. That is, if they can be worked with and if they show any signs of these diseases - which they may not. My very quick skim of the literature found that bats used for neurological studies and for Hendra virus.